
What Is a Particulate Diagram? Particle Models Explained
A particulate diagram shows matter as individual particles. Learn how particle diagrams represent solids, liquids, gases, elements, compounds, and mixtures, with examples.
A particulate diagram zooms in on matter and draws it as what it really is: a collection of tiny particles. By showing atoms, molecules, and ions as simple circles, these diagrams make abstract ideas — states of matter, the difference between an element and a compound, what happens in a reaction — visible and concrete.
This guide explains what a particulate diagram is, how it represents the states and types of matter, and how to draw one correctly.
Quick Answer: What Is a Particulate Diagram?
A particulate diagram (also called a particle diagram or particle model) is a drawing that represents a substance as individual particles — usually small circles standing for atoms, molecules, or ions. The arrangement, spacing, and grouping of the circles show the state of matter and the type of substance.
Because real samples contain far too many particles to draw, a particulate diagram uses a small, countable number that still captures the correct pattern.
The Particle Model: Solids, Liquids, and Gases
The most common use of a particulate diagram is to show the three states of matter. The particles are the same — only their arrangement and movement change.
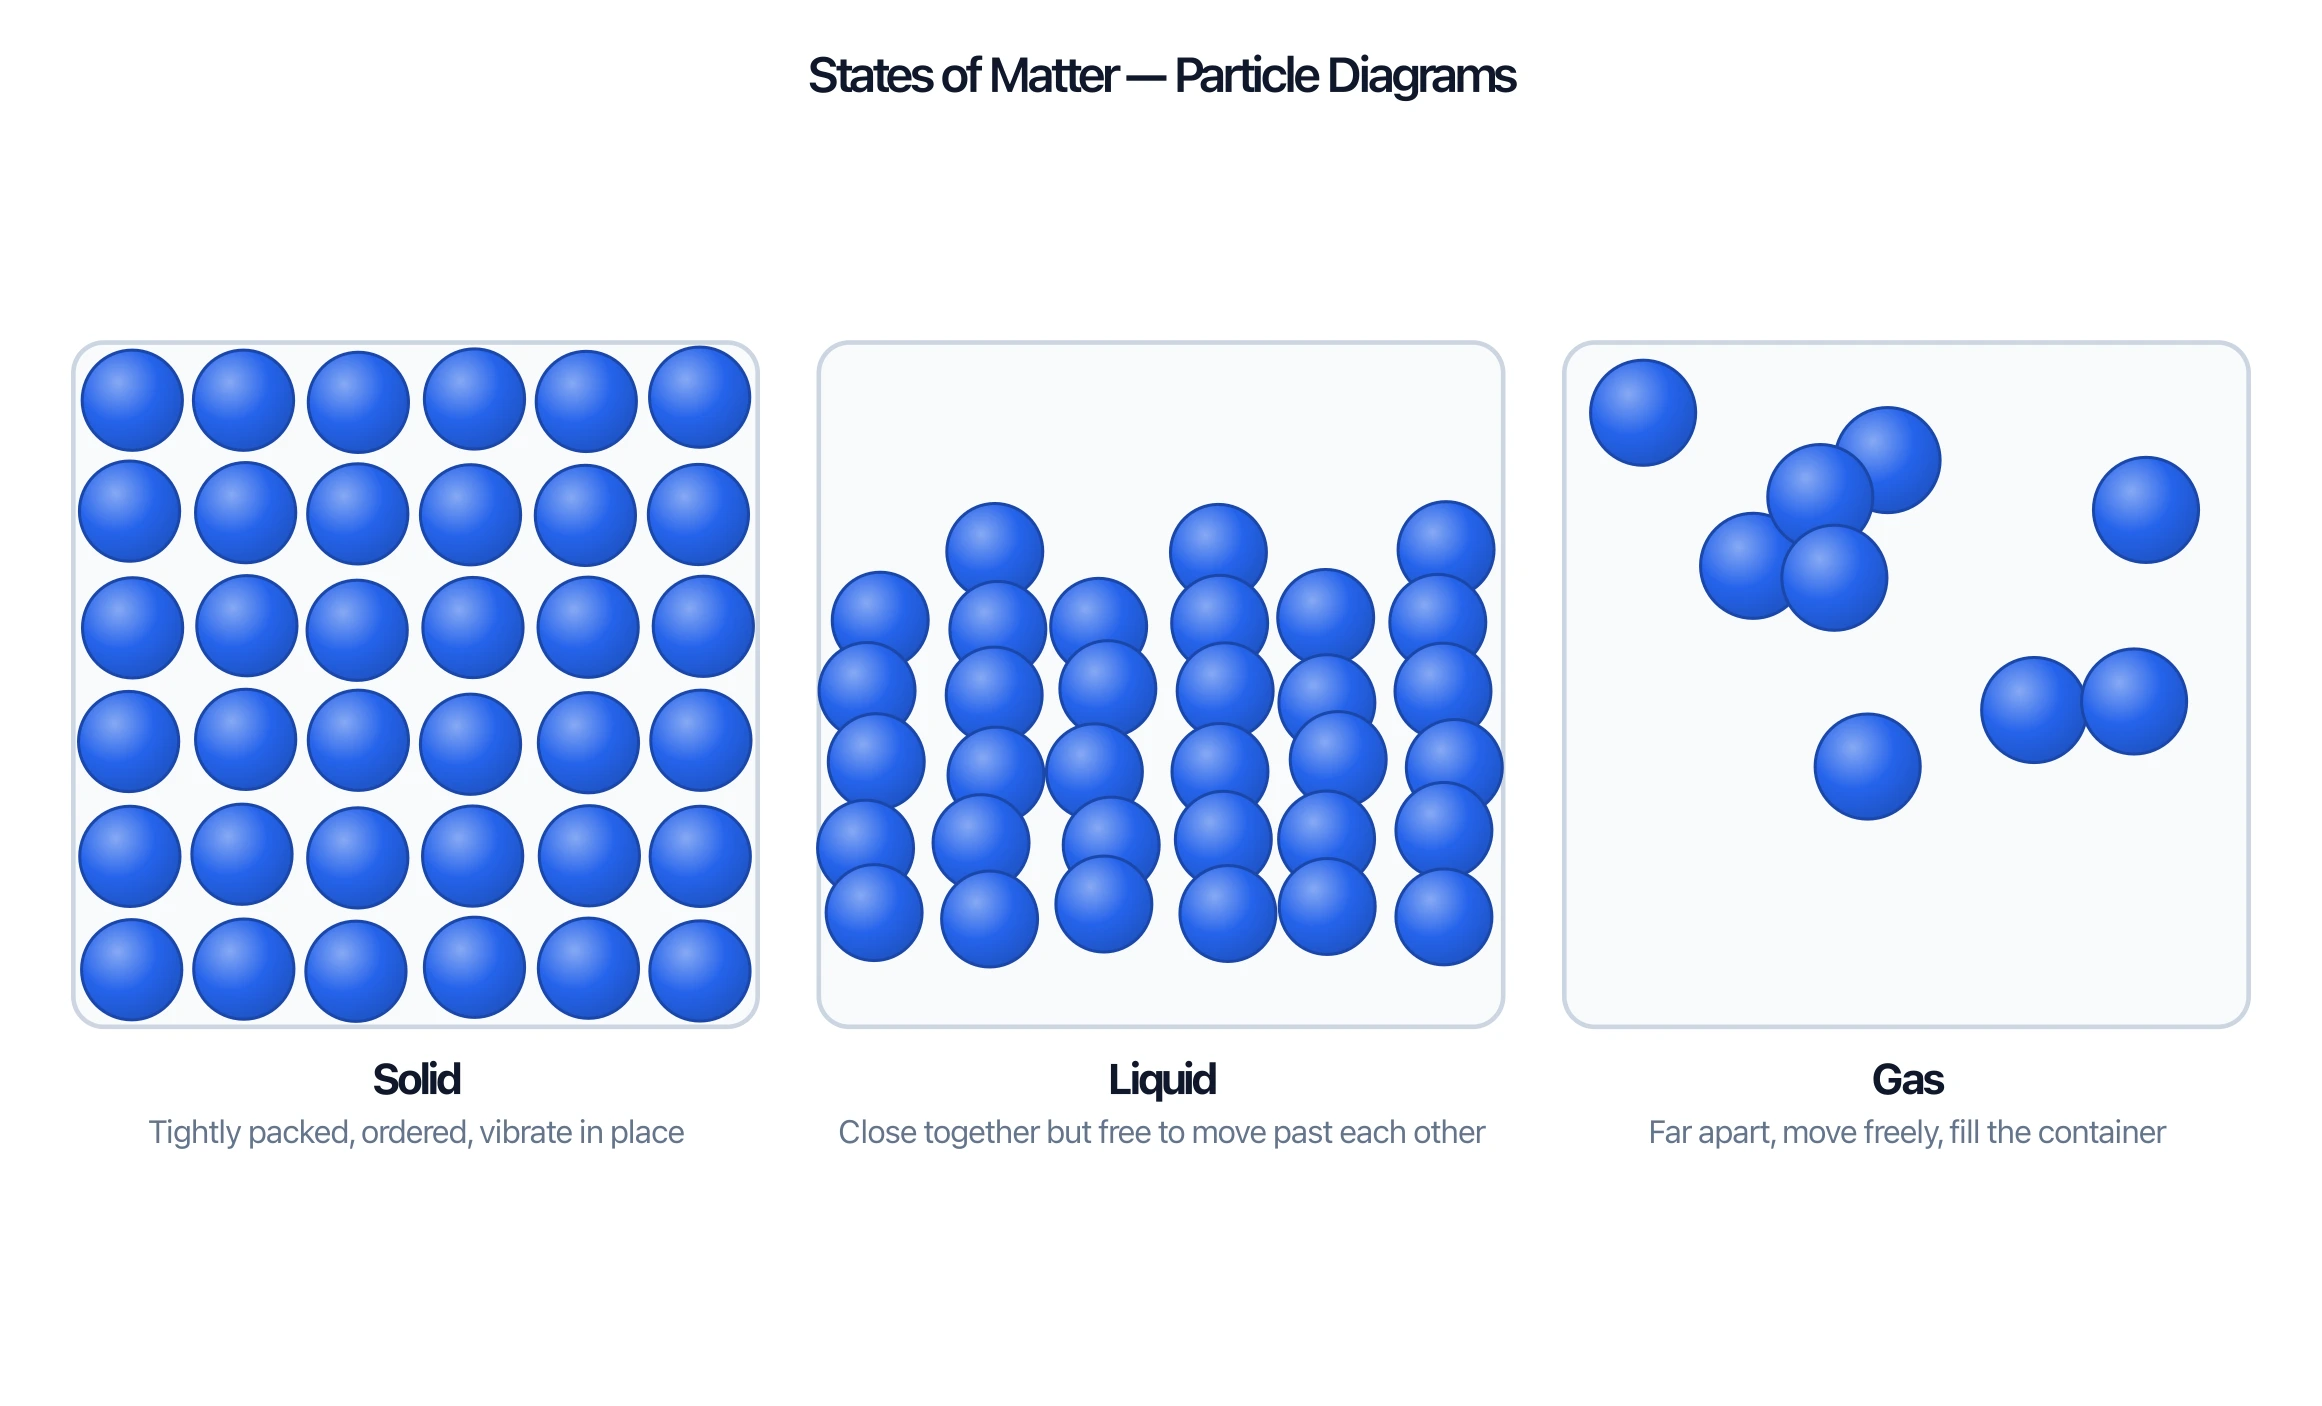
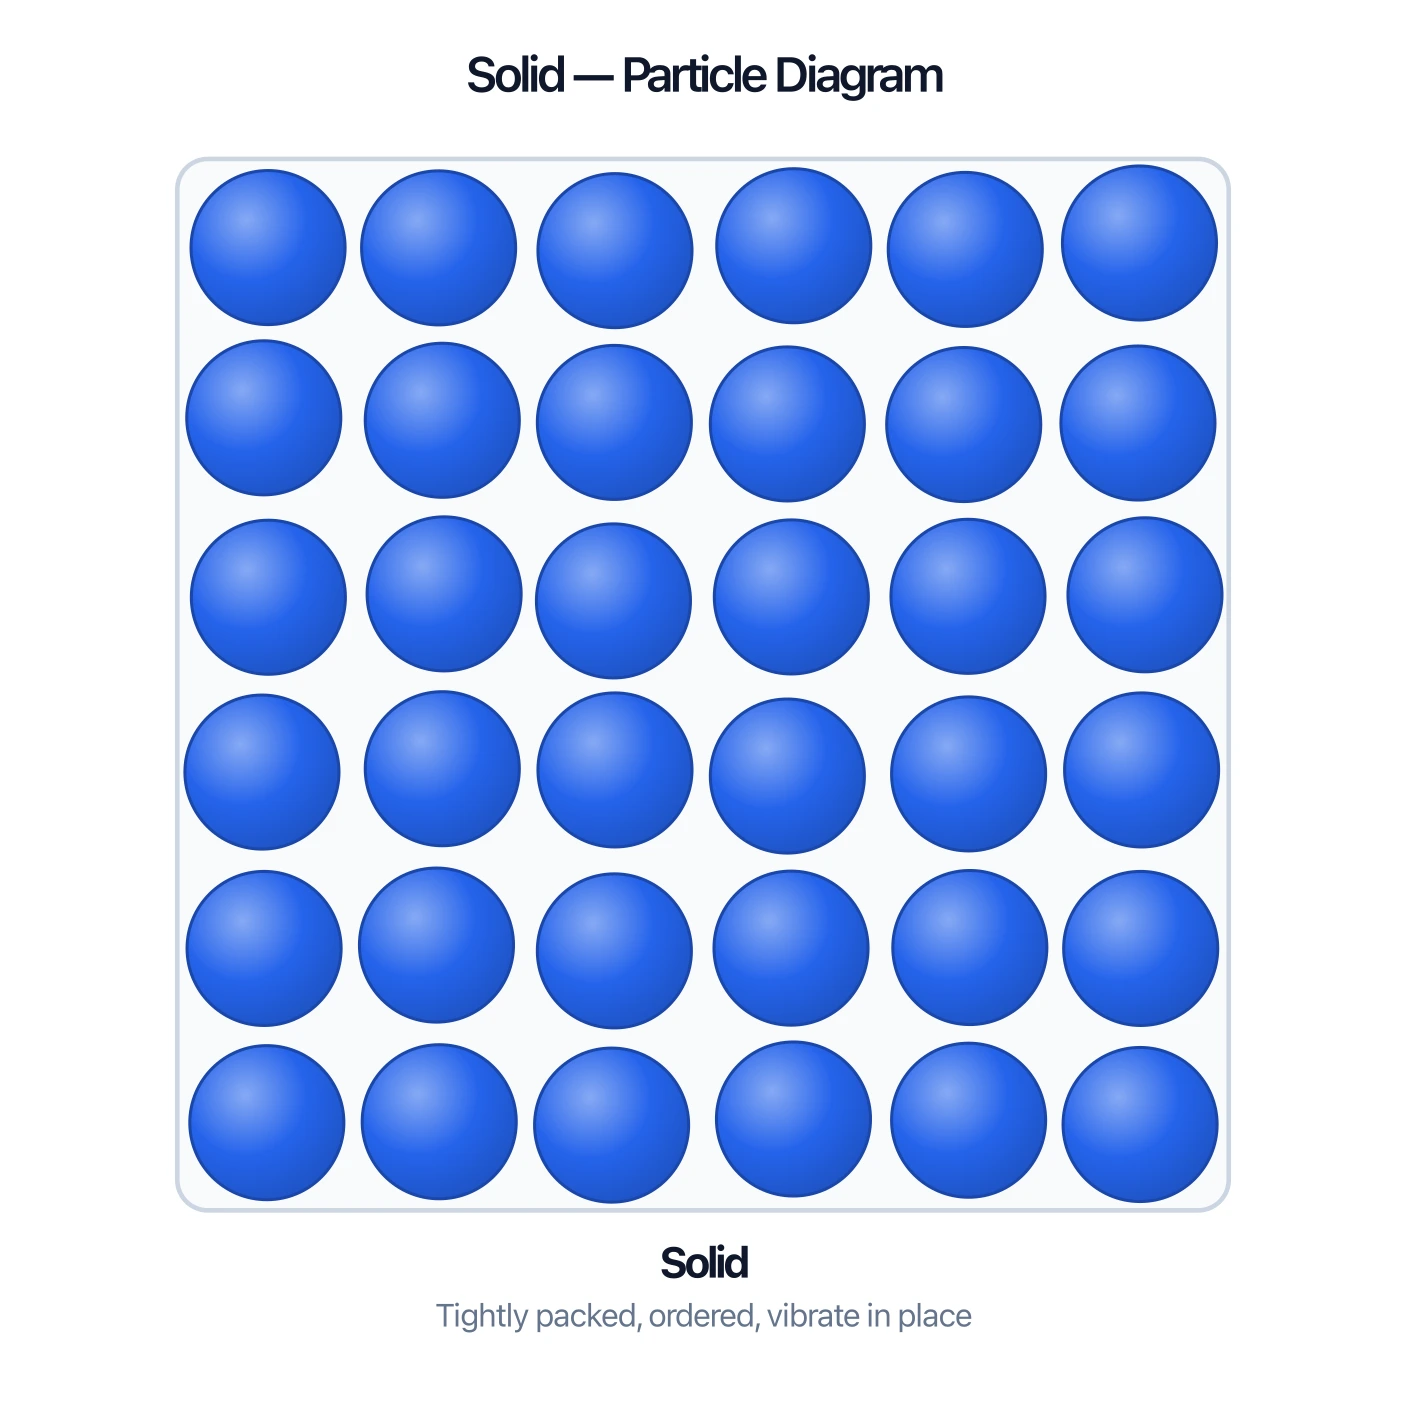
- Solid: particles are tightly packed in a fixed, ordered arrangement and only vibrate in place. This gives solids a fixed shape and volume.
- Liquid: particles are still close together but are free to move past one another, so a liquid flows and takes the shape of its container.
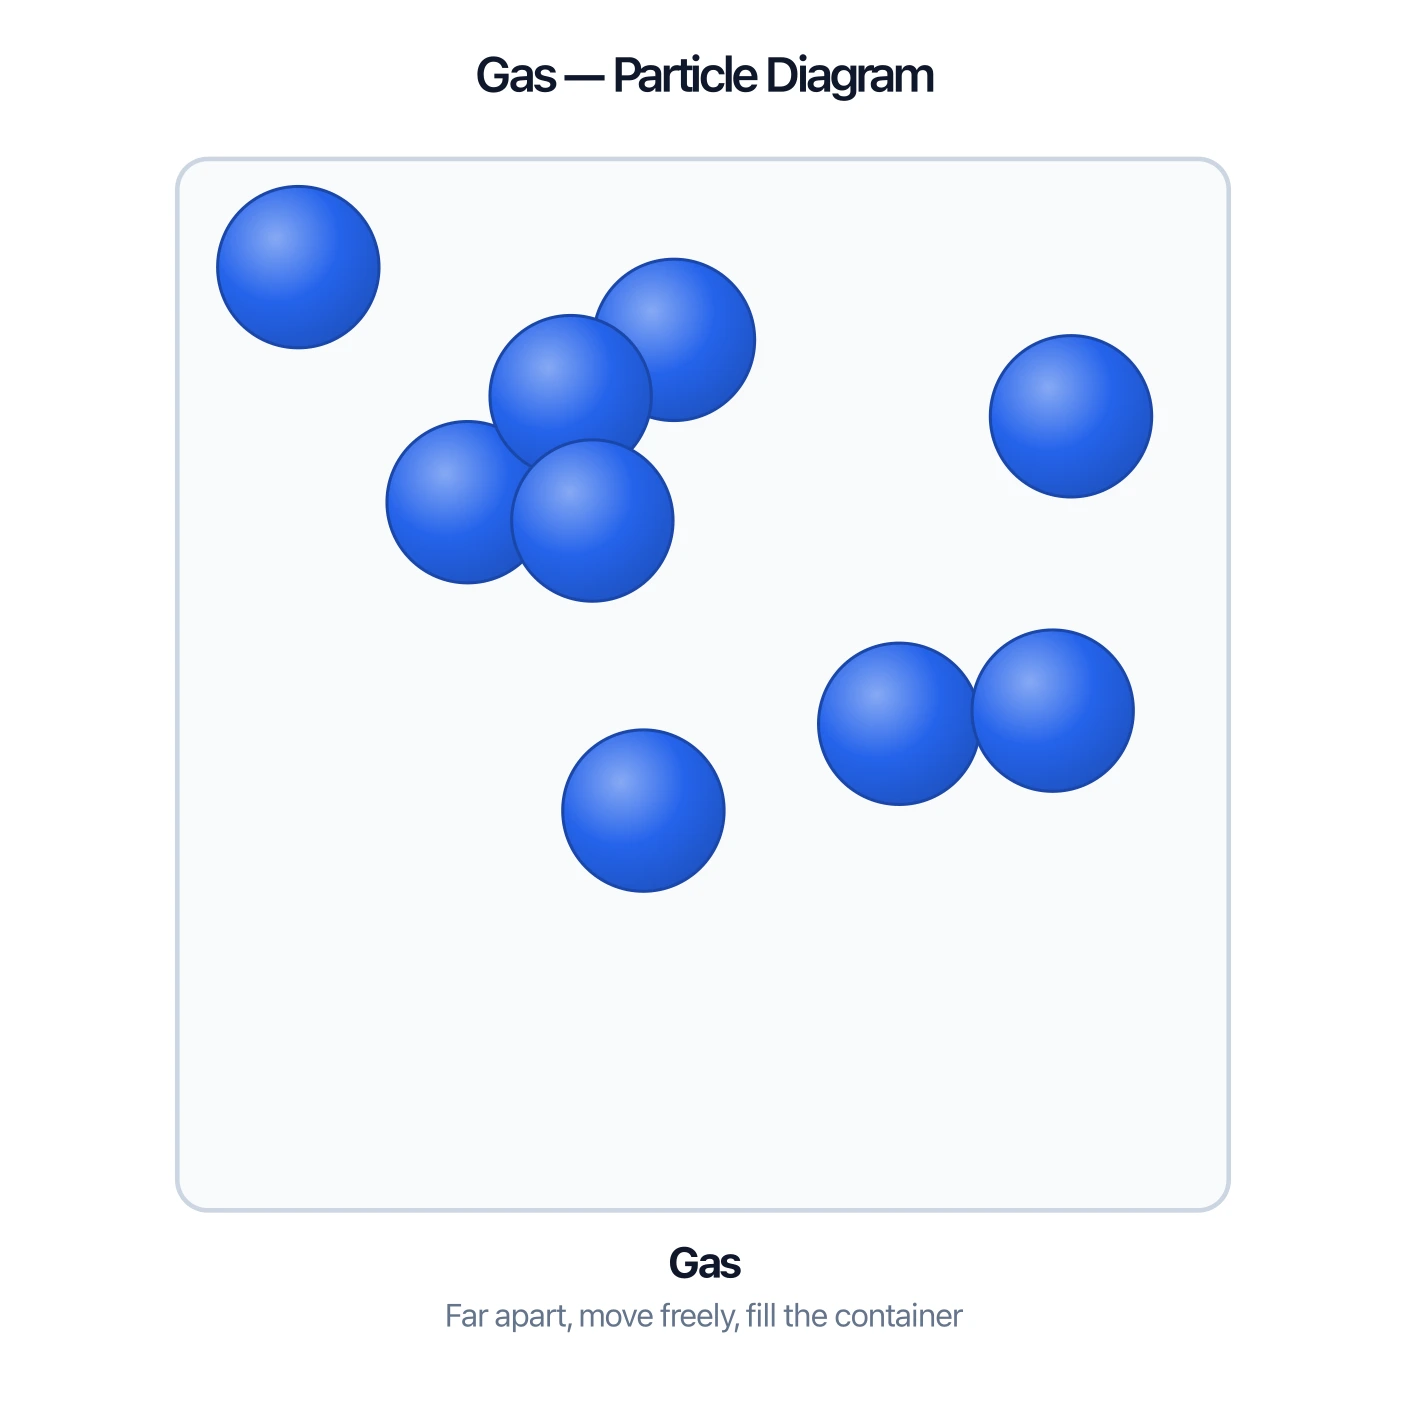
- Gas: particles are far apart and move quickly in all directions, so a gas spreads to fill its container.
The same logic explains changes of state: heating a solid lets its particles break free into a liquid, and heating a liquid lets them spread into a gas.
Particle Diagram Generator
Create particulate diagrams for states of matter and for elements, compounds, and mixtures, then download them free as SVG or PNG.
Make a particle diagram ->Elements, Compounds, and Mixtures
Particulate diagrams also show the type of matter by how the circles are colored and grouped:
- An element is drawn as particles of a single kind (one color).
- A compound is drawn as particles of different kinds bonded together in a fixed ratio.
- A mixture shows two or more kinds of particles that are not bonded, just mixed.
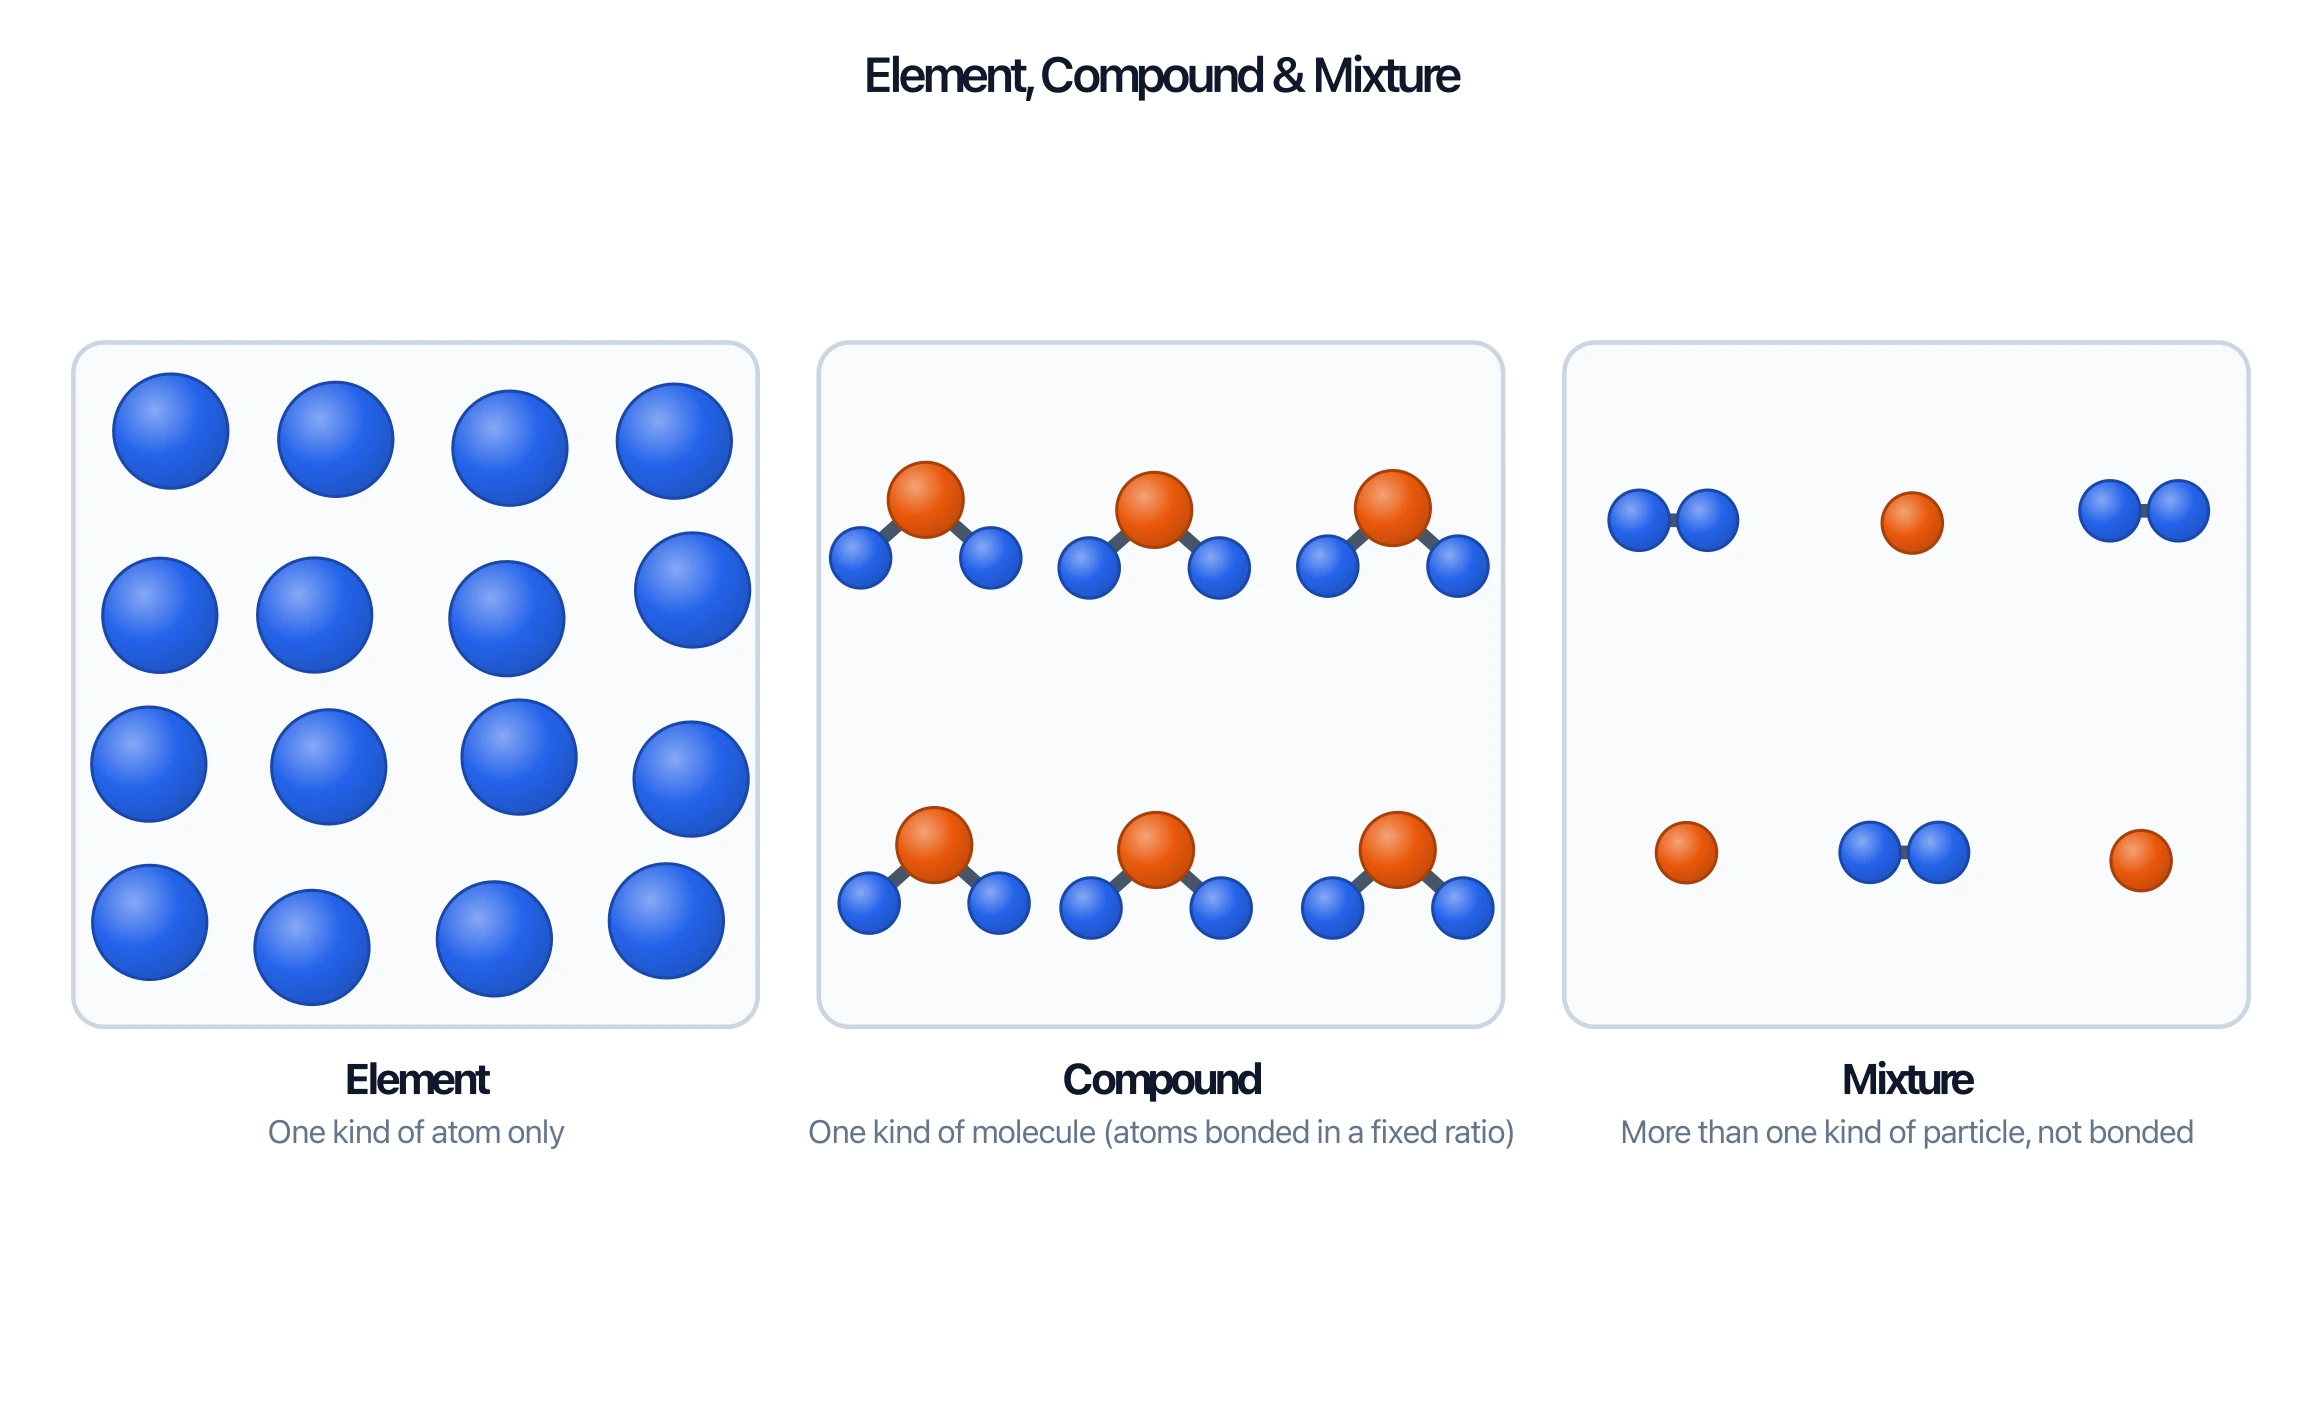
This is one of the clearest ways to teach the difference: a compound's particles are always joined in the same combination, while a mixture's are simply found together in any proportion.
Particulate Diagrams of Chemical Reactions
In AP Chemistry and similar courses, particulate diagrams are used to represent chemical reactions. You draw the particles of the reactants on one side and the products on the other. Done correctly, they make the conservation of mass obvious: every atom on the reactant side must appear on the product side — atoms are only rearranged, never created or destroyed.
These diagrams are also used to show concentration, limiting reactants, and the difference between a physical change (particles rearranged in space) and a chemical change (particles rebonded into new substances).
How to Draw a Particulate Diagram
- Choose a small, countable number of particles — enough to show the pattern, not the real count.
- Use a consistent symbol for each kind of atom — same color or shading for the same element.
- Show bonding correctly: touch or join particles that are chemically bonded; keep separate particles apart.
- Match the spacing to the state: packed for solid, close but irregular for liquid, far apart for gas.
- Keep the ratio right — a compound must always show the same combining ratio.
Common Mistakes
- Wrong spacing for the state. Solids are ordered and packed; gases are spread out. Don't draw them the same.
- Confusing compounds and mixtures. Bonded particles = compound; unbonded mix = mixture.
- Breaking conservation of mass. In a reaction diagram, the atoms before and after must match exactly.
- Inconsistent symbols. The same element must look the same throughout the diagram.
FAQ
What is a particulate diagram?
A particulate diagram is a drawing that represents a substance as individual particles (circles standing for atoms, molecules, or ions). Their arrangement, spacing, and grouping show the state of matter and the type of substance.
What is the difference between a particle diagram and a particulate diagram?
They mean the same thing. Both show matter as discrete particles. "Particulate diagram" is the term most common in AP Chemistry; "particle diagram" is used more broadly.
How do particulate diagrams show states of matter?
By particle spacing and arrangement: solids have packed, ordered particles; liquids have close but mobile particles; gases have widely spaced, fast-moving particles.
How do you show an element, compound, and mixture?
An element is one kind of particle; a compound is different particles bonded together in a fixed ratio; a mixture is different particles not bonded, just mixed together.
Why are particulate diagrams useful in chemistry?
They make abstract ideas visible — states of matter, types of matter, and the conservation of mass in reactions — by showing what is happening at the level of individual particles.
Related Guides
- What Is a Tape Diagram? — another classroom diagram that makes an abstract idea visible, this time for math word problems.
Further Reading
Catégories
Plus d'articles

7 Best Free Lucidchart Alternatives 2026: No 3-Doc Limit
Lucidchart limits free accounts to 3 documents. These 7 alternatives offer unlimited diagrams free: draw.io, Canva, Miro, Excalidraw & ConceptViz.
")
How to Make a Histogram in Excel: Step-by-Step Guide (2026)
Learn how to create a histogram in Excel with the built-in Histogram chart, bin controls, and formatting tips. Includes Excel 365, 2024, 2021, 2019, and 2016 guidance.
: Tips, Slide Examples & Presentation Guide (2026)")
3 Minute Thesis (3MT): Tips, Slide Examples & Presentation Guide (2026)
3MT tips and winning slide examples. Learn how to design your 3 Minute Thesis slide, structure your presentation, and avoid common mistakes.