")
How to Make a Concept Map: Step-by-Step Guide for Students and Researchers (2026)
Learn how to make a concept map for research papers, studying, and brainstorming. Covers structure, linking phrases, tools, and common mistakes with clear examples.
A concept map is one of the most effective ways to organize what you know about a topic and see how ideas connect. Unlike a simple list or outline, a concept map makes relationships between concepts visible, which helps with studying, research planning, writing, and teaching.
The format was developed by Joseph Novak in the 1970s based on David Ausubel's learning theory, and it remains one of the most widely used visual learning tools in education and research. The University of North Carolina Learning Center describes concept maps as tools that help learners organize and represent knowledge of a subject. The core idea is simple: place concepts in nodes, then connect them with labeled links that explain the relationship.
This guide explains how to make a concept map from scratch, what makes a good one, common mistakes, and when to use a concept map instead of a mind map or outline.
Mind Map Generator
Create structured visual maps from a text description — great for brainstorming, studying, and research planning.
Create a concept map free →What Is a Concept Map?
A concept map is a diagram that shows relationships between ideas. It consists of three elements:
- Concepts — usually nouns or short phrases, placed inside boxes or circles
- Links — lines or arrows connecting concepts
- Linking phrases — words on the links that describe the relationship (e.g., "causes," "requires," "is a type of")
The linking phrases are what separate concept maps from most other diagram types. Without them, you have a network diagram or a mind map, but not a concept map.
Concept Map vs Mind Map
These two are often confused, but they serve different purposes:
| Feature | Concept Map | Mind Map |
|---|---|---|
| Structure | Network (any concept can link to any other) | Tree (branches from a central topic) |
| Links | Labeled with relationship phrases | Usually unlabeled |
| Cross-links | Encouraged | Rare |
| Best for | Showing how concepts relate to each other | Brainstorming and organizing subtopics |
| Reading direction | Multiple paths | Center outward |
If your goal is to show how things connect, use a concept map. If your goal is to brainstorm and categorize, a mind map may be faster to create.
When to Use a Concept Map
Concept maps are especially useful when:
- you need to understand or explain relationships between ideas
- you are studying for an exam and want to see how topics connect
- you are planning a research paper and need to map your theoretical framework
- you are teaching a subject and want students to see the big picture
- you are analyzing a complex system with many interacting parts
Common use cases
- Students: reviewing course material, preparing for exams, organizing essay arguments
- Researchers: mapping literature reviews, visualizing theoretical frameworks, planning methodology
- Teachers: explaining complex topics, assessing student understanding
- Teams: aligning on project scope, documenting processes, knowledge management
How to Make a Concept Map: Step by Step
Step 1: Define the focus question
Every good concept map starts with a clear question that defines its scope. Without a focus question, the map tends to sprawl without purpose.
Examples:
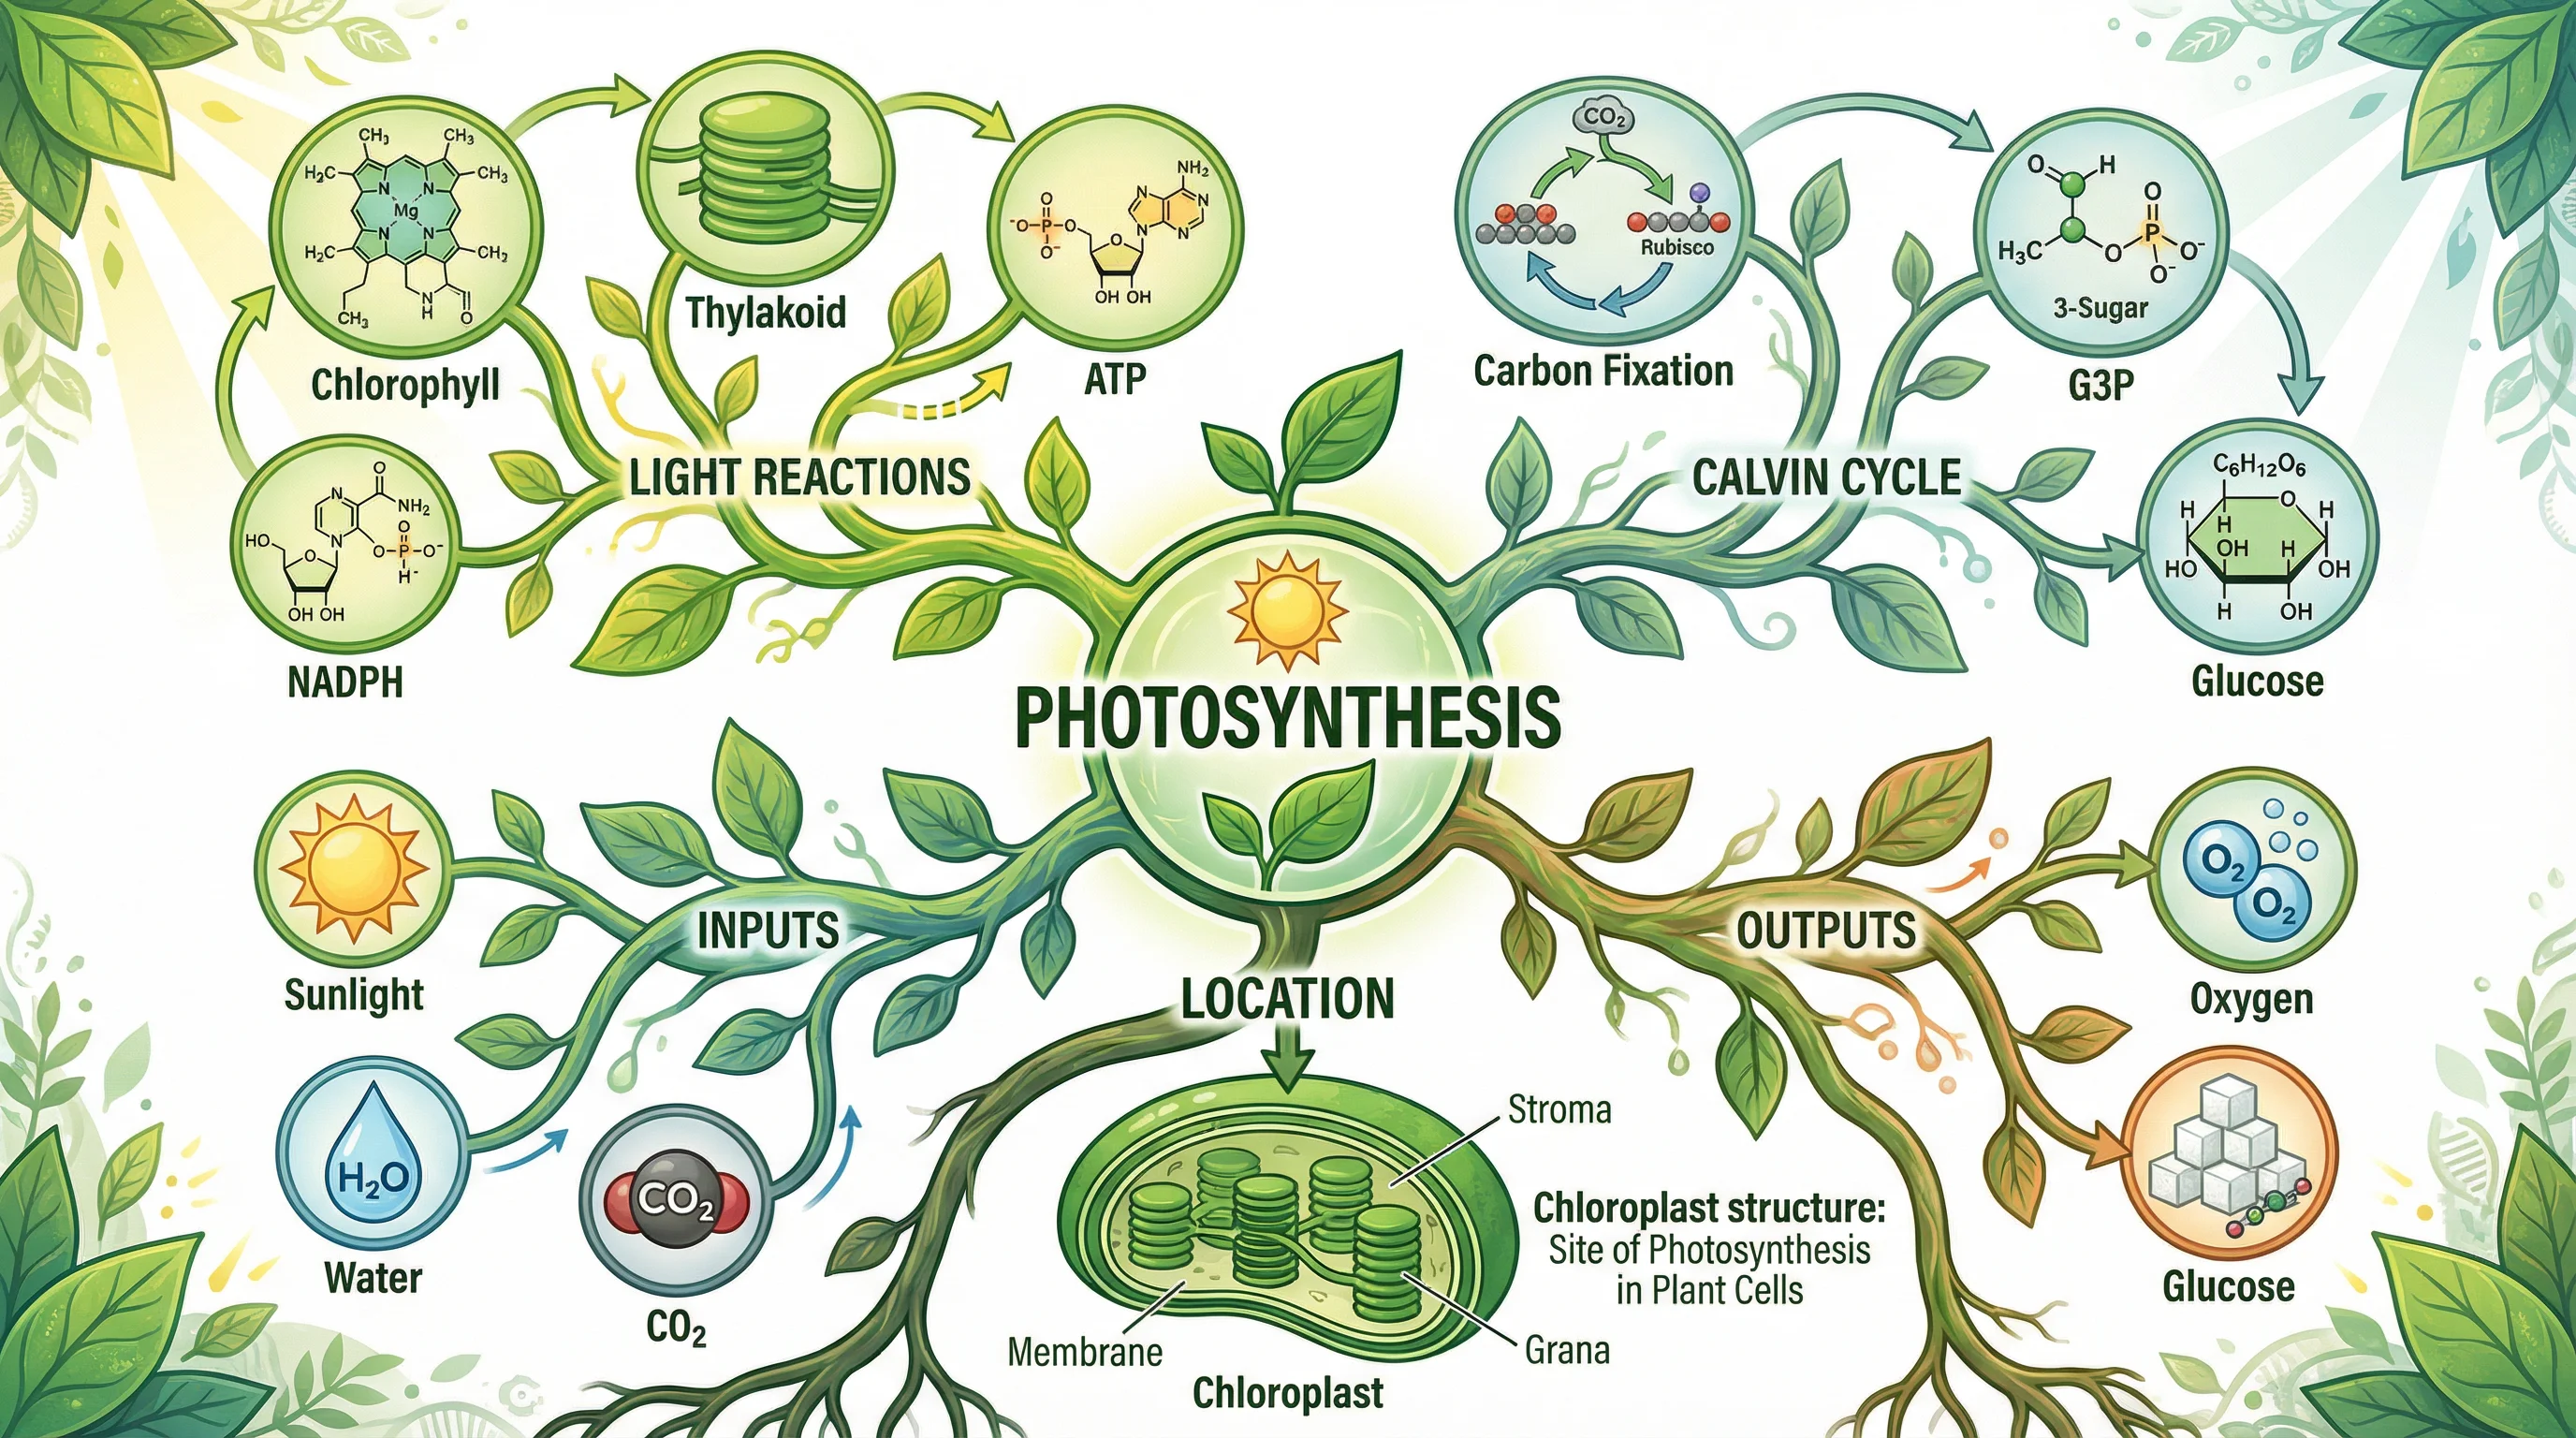
- "How does photosynthesis work?"
- "What factors affect employee retention?"
- "How do the components of the immune system interact?"
The focus question keeps you from trying to map everything at once.
Step 2: List the key concepts
Write down 15–25 concepts related to your focus question. At this stage, do not worry about organization — just capture the ideas.
For a concept map about photosynthesis, your list might include:
- sunlight, chlorophyll, chloroplast, water, carbon dioxide, glucose, oxygen, light reactions, Calvin cycle, ATP, NADPH, thylakoid, stroma, stomata, leaves
Step 3: Rank concepts from general to specific
Concept maps typically place the most general or inclusive concepts at the top and more specific concepts below. This hierarchy helps readers follow the logic.
- Top level: Photosynthesis
- Middle level: Light reactions, Calvin cycle
- Lower level: ATP, NADPH, glucose, oxygen
Step 4: Start placing concepts and drawing links
Begin with the most general concept at the top. Place related concepts nearby and draw lines between them.
The critical step: add linking phrases to every connection.
Bad: Photosynthesis → Light Reactions
Good: Photosynthesis — includes → Light Reactions
Without the linking phrase, the reader has to guess the relationship.
Step 5: Look for cross-links
Cross-links are connections between concepts in different branches of the map. They are one of the most valuable parts of a concept map because they show how ideas from different domains relate.
Example: A cross-link from "ATP" (in the light reactions branch) to "Calvin Cycle" (in a separate branch) with the phrase "provides energy for" reveals an important functional relationship.
Step 6: Revise and simplify
Your first draft will usually be messy. That is expected. Revise by:
- removing redundant concepts
- clarifying linking phrases
- improving the layout so it reads logically
- checking that every link has a meaningful phrase
A concept map is not finished when it has lots of nodes. It is finished when the relationships are clear.
What Makes a Good Concept Map
Clear hierarchy
The most general concepts sit at the top. Specific details and examples sit lower. This gives the map a readable top-to-bottom flow.
Meaningful linking phrases
Every link should form a readable proposition. For example: "Chlorophyll — absorbs → Sunlight" reads as a complete statement. If a link does not form a clear proposition, the phrase needs work.
Cross-links between branches
The best concept maps show connections across different parts of the topic. These cross-links often represent the deepest understanding.
Appropriate scope
A concept map that tries to include everything becomes unreadable. Keep the scope focused on your question.
Common Concept Map Mistakes
Mistake 1: Missing linking phrases
This is the most common error. Without linking phrases, the map is just a network of bubbles with no explanatory power.
Mistake 2: Too many concepts at once
Start with 15–25 concepts. You can always add more later, but starting with too many creates a tangled map.
Mistake 3: No clear hierarchy
If general and specific concepts are scattered randomly, the map becomes hard to read. Place general concepts higher.
Mistake 4: Confusing a concept map with a mind map
Mind maps branch from a center with no linking phrases. Concept maps are networks with labeled relationships. Using one format when you mean the other leads to a diagram that does not fully serve either purpose.
Mistake 5: Treating it as decoration
A concept map should be a thinking tool, not a poster. If it looks pretty but the relationships are vague, it is not doing its job.
Tools for Making Concept Maps
By hand
Paper and sticky notes are still effective for first drafts. You can rearrange concepts physically before committing to a digital version.
Dedicated software
Tools like CmapTools (free, developed by the Florida Institute for Human and Machine Cognition) are specifically designed for concept mapping with proper linking phrases and hierarchical layouts. The IHMC also publishes the foundational theory of concept maps by Novak and Cañas.
General diagramming tools
Tools like draw.io, Miro, or Lucidchart can create concept maps, though they require more manual effort to add linking phrases consistently.
AI-powered tools
If you want a faster starting point, ConceptViz Mind Map Generator can create structured visual maps from a text description, which you can then refine into a full concept map with linking phrases.
Conceptual Framework Generator
Generate research-ready conceptual framework diagrams showing variable relationships.
Concept Maps in Research
Concept maps have specific applications in academic research:
Literature reviews
Map the key theories, variables, and findings from your sources to see how the literature connects and where gaps exist.
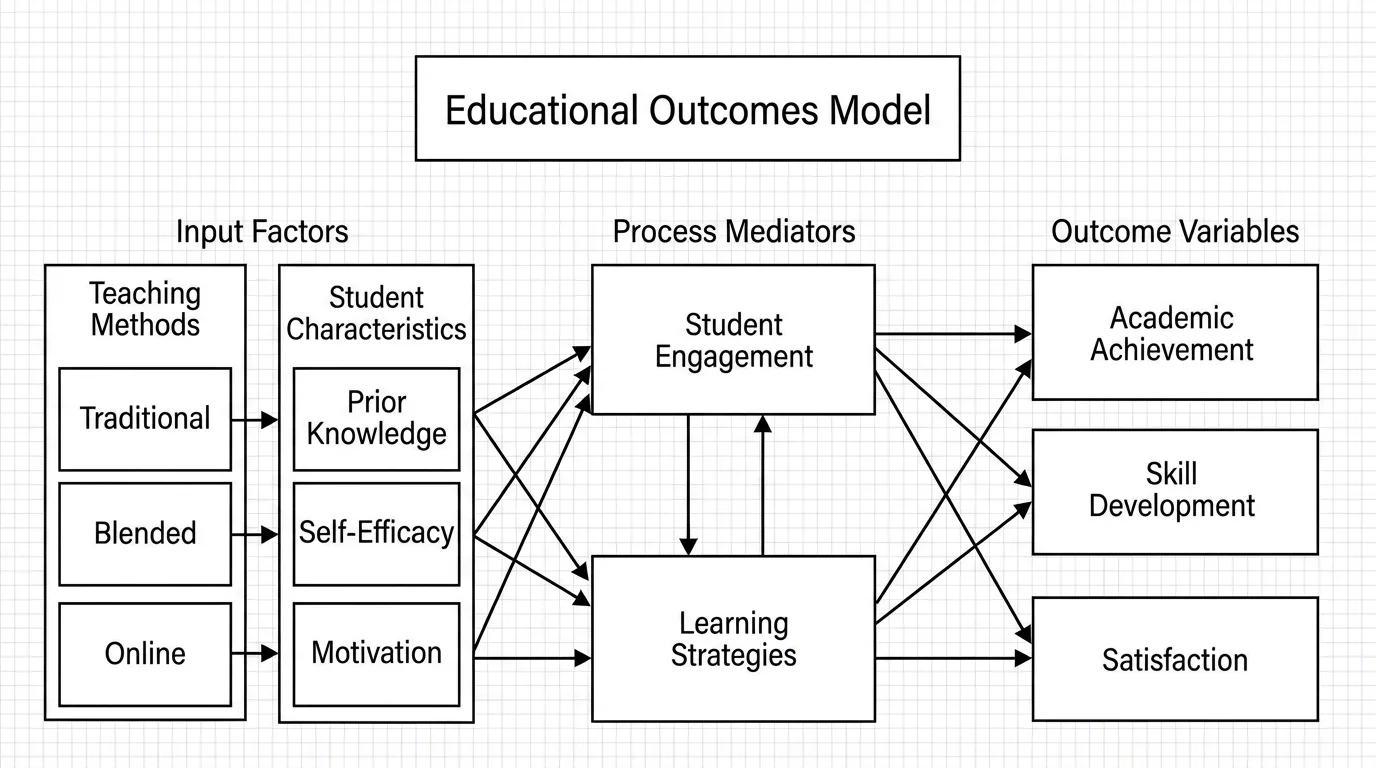
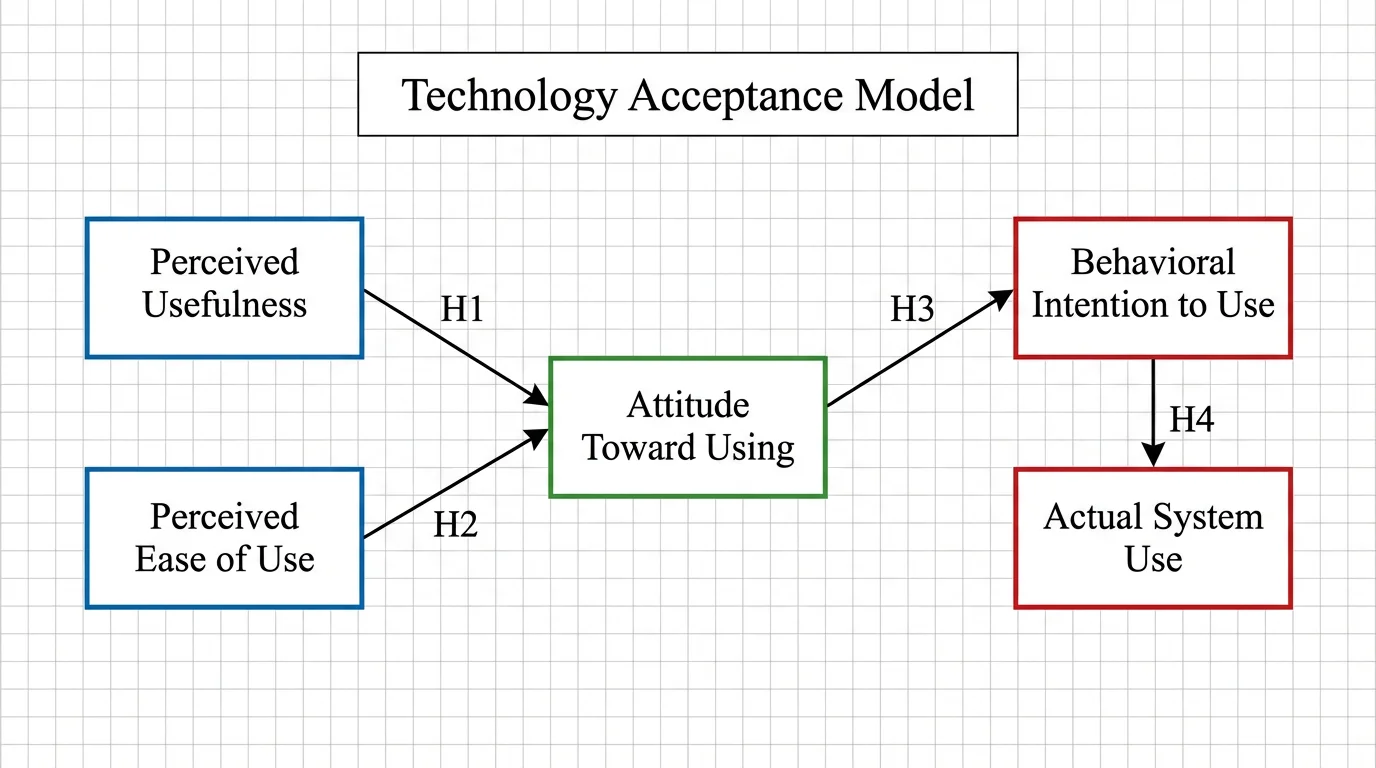
Theoretical frameworks
A concept map can serve as the visual representation of your theoretical framework, showing how independent and dependent variables relate through mediating concepts.
For a deeper guide on building frameworks, see how to create a conceptual framework for a research paper.
Study design
Before collecting data, map the concepts you plan to measure and the relationships you expect to find. This helps clarify hypotheses and identify confounding variables.
Knowledge assessment
Instructors use concept maps to assess how well students understand relationships between topics — not just whether they can recall facts.
Example: Climate Change Concept Map
Focus question: "What are the main causes and effects of climate change?"
Top-level concept: Climate Change
Second level: Greenhouse Gases, Temperature Rise, Sea Level Rise, Ecosystem Disruption
Third level: CO2, Methane, Deforestation, Fossil Fuels, Ice Melt, Coral Bleaching, Species Migration
Sample propositions:
- Climate Change — is caused by → Greenhouse Gases
- Greenhouse Gases — include → CO2 and Methane
- Fossil Fuels — release → CO2
- Temperature Rise — causes → Ice Melt
- Ice Melt — leads to → Sea Level Rise
Cross-link: Deforestation — reduces → Carbon Absorption (connecting to the CO2 branch)
This example shows how a concept map reveals both the causal chain and the feedback loops in a complex system.
Frequently Asked Questions
What is the difference between a concept map and a mind map?
A concept map is a network diagram with labeled links that form propositions between concepts. A mind map branches from a central topic without labeled relationships. Concept maps show how ideas relate; mind maps organize subtopics hierarchically.
How many concepts should a concept map have?
Start with 15 to 25 concepts for a focused topic. You can always add more later, but starting with too many creates a tangled, unreadable map.
What are linking phrases in a concept map?
Linking phrases are words placed on the lines between concepts that describe the relationship, such as 'causes,' 'requires,' 'is a type of,' or 'leads to.' They turn connections into readable propositions.
Can I use a concept map for a research paper?
Yes. Concept maps are widely used for literature reviews, theoretical frameworks, and study design. They help visualize relationships between variables and identify gaps in existing research.
What is the best tool for making concept maps?
CmapTools is a free tool specifically designed for concept mapping. General tools like draw.io and Miro also work but require more manual setup. For a fast starting point, AI-powered visual generators can create an initial structure you refine.
Do concept maps have to be hierarchical?
Typically yes — the most general concepts go at the top and more specific ones below. But the network structure also allows cross-links between any concepts, so the hierarchy is a guideline, not a strict rule.
How do I know if my concept map is good?
A good concept map has clear linking phrases on every connection, a readable hierarchy from general to specific, meaningful cross-links between branches, and an appropriate scope tied to a focus question.
Conclusion
Making a concept map is straightforward once you follow the core process:
- Start with a clear focus question
- List and rank your concepts
- Place them in a hierarchy
- Connect them with labeled linking phrases
- Look for cross-links between branches
- Revise until the relationships are clear
The real value of a concept map is not the diagram itself — it is the thinking process that building one forces you to do. If you can read every link as a clear proposition, you understand the topic well.
For a faster starting point, try ConceptViz Mind Map Generator to create structured visual maps, or the Conceptual Framework Generator for research-specific relationship diagrams.
Additional Resources:
Catégories
Plus d'articles
")
How to Draw a Box and Whisker Diagram: Complete Step-by-Step Guide (2026)
Learn how to draw a box and whisker diagram from scratch. Step-by-step tutorial covering hand-drawn, Excel, Python, and R methods with examples and common mistakes.
")
Free Printable Life Cycle Worksheets for Teachers (2026)
Download free printable life cycle worksheets for plants, butterflies, frogs, and chickens. Includes labeled diagrams, blank worksheets for quizzes, and hands-on activities aligned with NGSS standards.

Best AI Diagram Generators in 2026 Compared
Compare the top AI diagram generators for UML, ER, Venn, electrical, and architecture diagrams. Turn text into professional visuals in seconds.