
How to Create a Conceptual Framework for Your Research Paper: Complete Guide
Learn how to develop a strong conceptual framework for your thesis or dissertation. Includes step-by-step instructions, examples by discipline, templates, and visual diagram tips.
A conceptual framework is the backbone of any research study. It defines the key variables, establishes relationships between them, and provides the lens through which you analyze your findings. Yet many graduate students struggle to create one effectively.
This comprehensive guide walks you through everything you need to know about developing a conceptual framework—from understanding what it is to creating compelling visual diagrams that strengthen your research.
What Is a Conceptual Framework?
A conceptual framework is a visual or written representation that explains the main concepts or variables in your study and how they relate to each other. Think of it as your research's roadmap—it shows readers where you're going and how you'll get there.
According to USC Libraries, a conceptual framework "lies within a much broader framework called a theoretical framework" and helps researchers develop awareness and understanding of the situation under scrutiny.
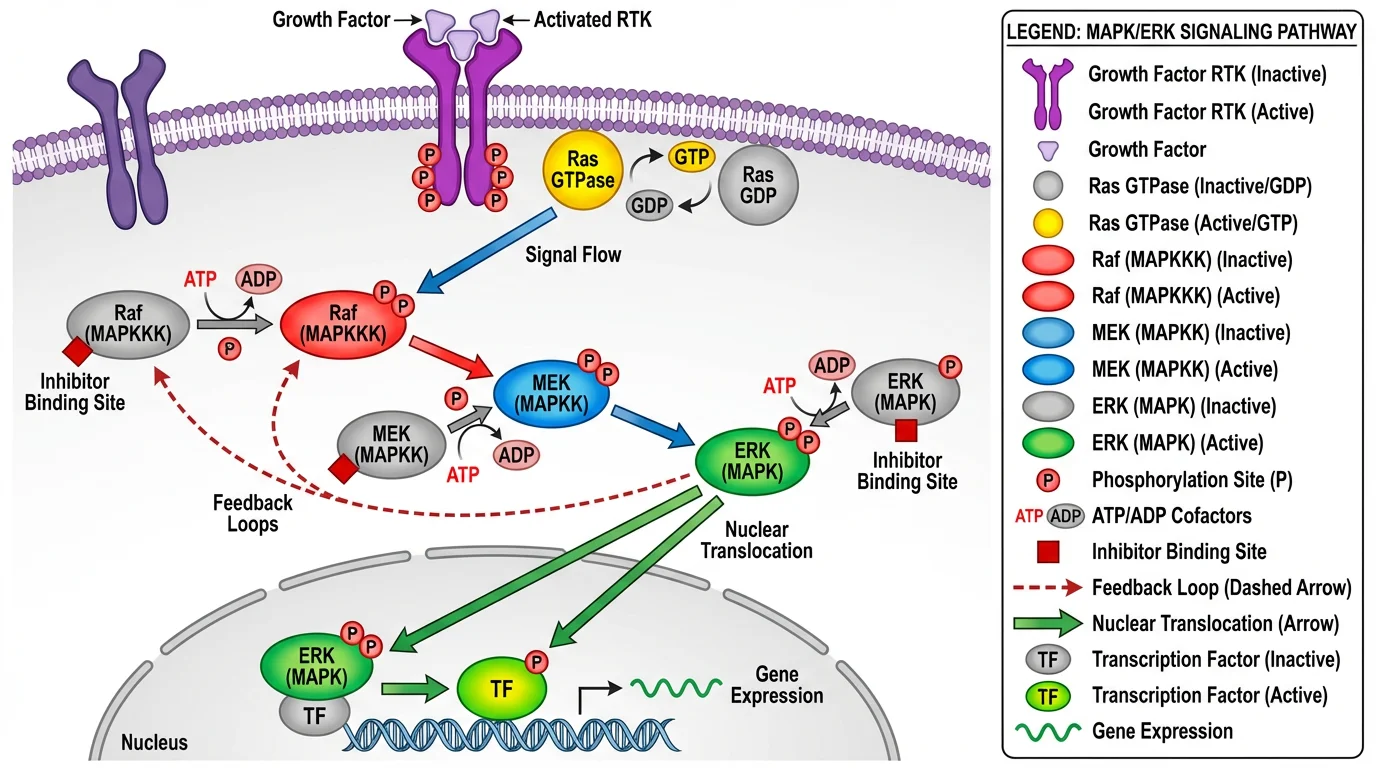
Complex pathway diagrams like this MAPK signaling cascade illustrate how conceptual frameworks map relationships between multiple variables
Key Characteristics of a Conceptual Framework
| Characteristic | Description |
|---|---|
| Variable-focused | Identifies and defines the key variables in your study |
| Relationship-driven | Shows how variables connect and influence each other |
| Research-specific | Tailored to your particular study, not generic |
| Visually representable | Can be illustrated as a diagram or model |
| Literature-based | Grounded in existing research and theories |
Conceptual Framework vs. Theoretical Framework
One of the most common points of confusion for graduate students is distinguishing between conceptual and theoretical frameworks. Here's how they differ:
| Aspect | Conceptual Framework | Theoretical Framework |
|---|---|---|
| Scope | Specific to your study | Broader, based on established theories |
| Purpose | Maps variables and relationships | Provides theoretical foundation |
| Source | Synthesized from literature review | Drawn from existing theories |
| Flexibility | Created by the researcher | Follows established structures |
| Focus | What you're studying | Why relationships exist |
How They Work Together
The theoretical framework provides the foundation—the established theories and concepts from your field. The conceptual framework builds on this by showing how those theories apply specifically to your research variables.
Example:
- Theoretical Framework: Social Cognitive Theory (Bandura)
- Conceptual Framework: How self-efficacy, observational learning, and environmental factors influence student academic performance in online courses
Why Your Research Needs a Conceptual Framework
A well-developed conceptual framework serves multiple purposes:
1. Clarifies Research Focus
By mapping out your variables and relationships, you crystallize exactly what you're studying. This prevents scope creep and keeps your research focused.
2. Guides Methodology
Your framework determines what data you need to collect and how to analyze it. Each variable in your framework should connect to your research methods.
3. Strengthens Literature Review
Creating a framework forces you to synthesize literature rather than just summarize it. You must identify how different studies and theories connect.
4. Improves Communication
A visual framework communicates complex relationships at a glance. Committee members and readers can quickly understand your research design.
5. Facilitates Analysis
When analyzing findings, your framework provides the structure for interpretation. You examine how your data confirms or challenges the proposed relationships.
Step-by-Step Guide to Creating Your Conceptual Framework
Step 1: Identify Your Research Problem and Questions
Start with your research problem. What gap in knowledge are you addressing? What questions are you trying to answer?
Write down:
- Your main research question
- Sub-questions or hypotheses
- The specific problem you're investigating
Step 2: Conduct a Thorough Literature Review
Your framework emerges from the literature. As you review sources, look for:
- Key concepts and definitions used by researchers in your field
- Variables that have been studied in relation to your topic
- Relationships that previous research has identified
- Theories that explain the phenomena you're studying
- Gaps that your research will address
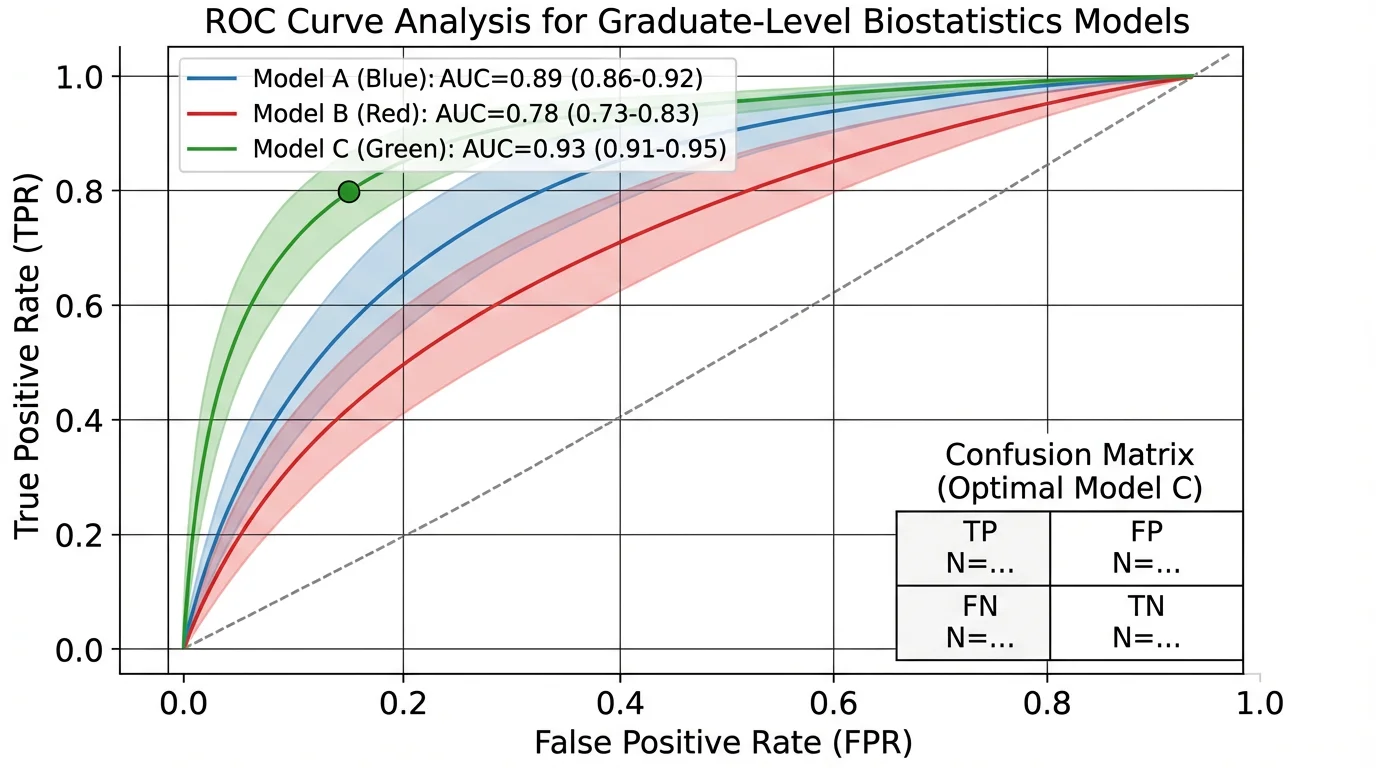
Data analysis frameworks like ROC curves emerge from understanding the relationships between variables in your study
Step 3: Identify Key Variables
From your literature review, identify the core variables in your study:
Types of Variables:
| Variable Type | Definition | Example |
|---|---|---|
| Independent | Variables you manipulate or observe as potential causes | Teaching method, training program |
| Dependent | Variables you measure as outcomes | Test scores, job performance |
| Mediating | Variables that explain the relationship between IV and DV | Motivation, engagement |
| Moderating | Variables that affect the strength of relationships | Age, experience level |
| Control | Variables held constant or accounted for | Prior knowledge, socioeconomic status |
Step 4: Define Relationships
For each pair of related variables, specify:
- Direction: Does A influence B, or is it reciprocal?
- Nature: Is the relationship positive, negative, or complex?
- Mechanism: How does the influence occur?
- Evidence: What literature supports this relationship?
Step 5: Create Your Visual Diagram
Now translate your variables and relationships into a visual representation. Common formats include:
Input-Process-Output Model:
[Inputs] → [Processes] → [Outputs]Hierarchical Model:
        [Overarching Concept]
              ↓
    [Category A]  [Category B]
         ↓             ↓
  [Variables]    [Variables]
Network Model:
    [Variable A] ←→ [Variable B]
         ↓               ↓
    [Variable C] ←→ [Variable D]
Step 6: Refine and Validate
Once you have a draft framework:
- Check alignment with your research questions
- Verify literature support for each relationship
- Get feedback from advisors and peers
- Simplify if needed—clarity is more important than complexity
Conceptual Framework Examples by Discipline
Social Sciences Example
Study: Impact of Remote Work on Employee Well-being
Independent Variables:
├── Work Schedule Flexibility
├── Communication Technology Quality
└── Manager Support Level
        ↓
Mediating Variables:
├── Work-Life Balance
└── Social Connection
        ↓
Dependent Variable:
└── Employee Well-being (psychological, physical)

Moderating Variables:
├── Personality Type
└── Home Environment
Health Sciences Example
Study: Factors Affecting Medication Adherence in Diabetes Patients
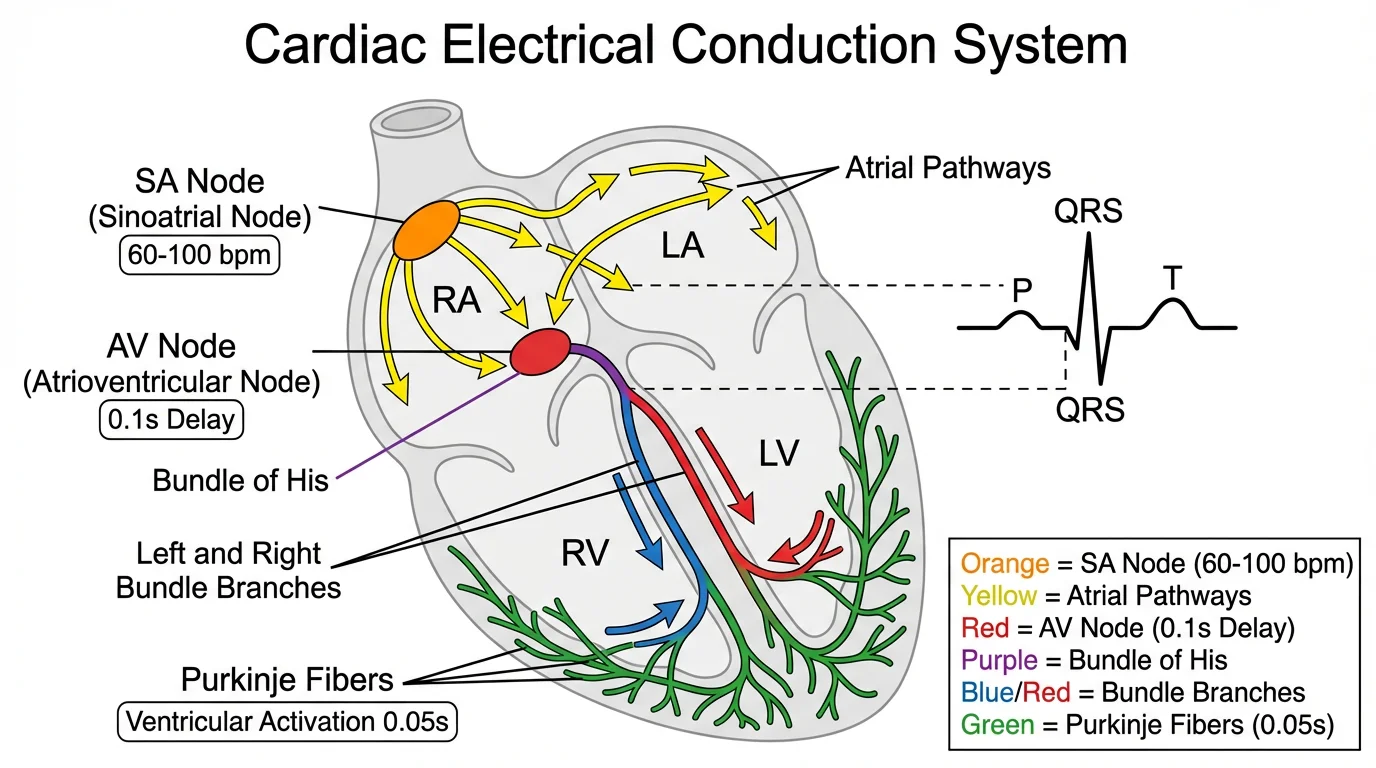
Medical research frameworks often map complex physiological or behavioral relationships like those in this cardiac system diagram
Patient Factors:
├── Health Literacy
├── Self-efficacy
└── Perceived Benefits
        ↓
System Factors:
├── Healthcare Access
├── Provider Communication
└── Cost/Insurance
        ↓
        Medication Adherence
        ↓
Health Outcomes:
├── HbA1c Levels
├── Complications
└── Quality of Life
Education Example
Study: Technology Integration in Science Education
Teacher Factors:
├── Pedagogical Knowledge
├── Technical Skills
└── Beliefs about Technology
        ↓
Implementation:
├── Frequency of Use
├── Type of Technology
└── Instructional Strategies
        ↓
Student Outcomes:
├── Science Content Knowledge
├── 21st Century Skills
└── Engagement
Business/Management Example
Study: Customer Loyalty in E-commerce
Service Quality:
├── Website Usability
├── Product Quality
└── Customer Service
        ↓
Customer Perception:
├── Satisfaction
├── Trust
└── Value Perception
        ↓
Behavioral Outcomes:
├── Repeat Purchase
├── Word of Mouth
└── Loyalty
Creating Visual Diagrams for Your Framework
A well-designed visual diagram makes your framework immediately understandable. Here's how to create effective visualizations:
Design Principles
- Use clear shapes: Boxes for variables, arrows for relationships
- Maintain hierarchy: Most important concepts should be prominent
- Apply color purposefully: Different colors for different variable types
- Keep it readable: Adequate spacing and font size
- Include a legend: Explain symbols and colors used
For guidance on visual design, see our scientific color palette guide and best fonts for scientific figures.
Tools for Creating Framework Diagrams
| Tool | Best For | Learning Curve | Cost |
|---|---|---|---|
| PowerPoint/Keynote | Quick diagrams | Low | Included with Office |
| ConceptViz | AI-generated frameworks | Low | Free tier available |
| Lucidchart | Detailed flowcharts | Medium | Freemium |
| draw.io | Flexible diagramming | Medium | Free |
| Adobe Illustrator | Publication-quality | High | Subscription |
Visual Framework Templates
Template 1: Linear Causal Model
┌─────────────────────────────────────────────────────────┐
│                                                         │
│  [IV 1]  ──┐                                           │
│            ├──→  [Mediator]  ──→  [Dependent Variable] │
│  [IV 2]  ──┘         ↑                                 │
│                      │                                 │
│              [Moderator]                               │
│                                                         │
└─────────────────────────────────────────────────────────┘
Template 2: Multi-Level Model
┌─────────────────────────────────────────────────────────┐
│  MACRO LEVEL                                            │
│  ┌──────────┐  ┌──────────┐  ┌──────────┐             │
│  │ Context 1│  │ Context 2│  │ Context 3│             │
│  └────┬─────┘  └────┬─────┘  └────┬─────┘             │
│       │             │             │                    │
│  MESO LEVEL        ↓             │                    │
│       └────→ [Organization] ←────┘                    │
│                    │                                   │
│  MICRO LEVEL       ↓                                   │
│            [Individual Outcomes]                       │
└─────────────────────────────────────────────────────────┘
Common Mistakes to Avoid
1. Too Many Variables
Including every possible variable creates confusion. Focus on the most important variables that directly relate to your research questions.
Fix: Limit to 5-8 core variables. Others can be mentioned in text but not visualized.
2. Vague Relationships
Arrows without explanation leave readers guessing. Every relationship should be theoretically justified.
Fix: For each arrow, ask "What theory or evidence supports this relationship?"
3. No Connection to Research Questions
Your framework should directly answer "How will you address your research questions?"
Fix: Trace each research question to specific variables and relationships in your framework.
4. Ignoring Alternative Explanations
A good framework acknowledges complexity, including variables that might compete with your hypothesized relationships.
Fix: Include potential confounding variables or alternative pathways.
5. Static Thinking
Many phenomena involve feedback loops and dynamic relationships, not just linear causation.
Fix: Consider bidirectional arrows and cyclical relationships where appropriate.
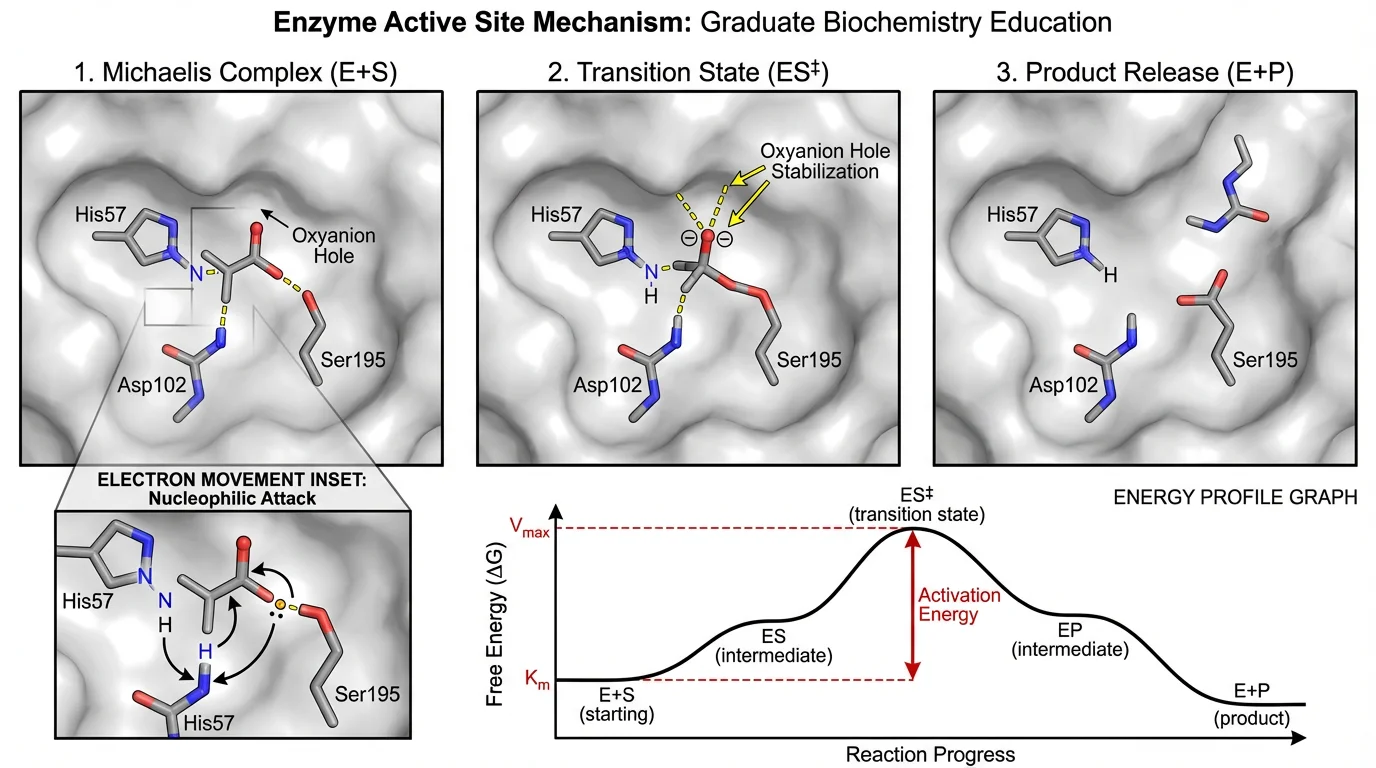
Like this enzyme mechanism showing substrate-enzyme interaction, conceptual frameworks should clearly depict how variables interact
Presenting Your Conceptual Framework
In Your Thesis/Dissertation
Your framework typically appears in the methodology chapter, but it should be developed during the literature review. Include:
- Visual diagram of the framework
- Written explanation of each component
- Justification from literature for each relationship
- Connection to your research questions and hypotheses
In Research Proposals
For grant applications and proposals, emphasize:
- How your framework addresses gaps in current knowledge
- The theoretical foundation supporting your approach
- How it guides your methodology
In Academic Papers
When publishing, your framework helps readers understand your approach. Place it early in the paper, either in the introduction or literature review section.
For more on structuring research papers, see our guide on how to write a research manuscript.
Iterating Your Framework
Your conceptual framework isn't static. It evolves through your research process:
During Literature Review
- Add variables as you discover them
- Refine relationships based on evidence
- Identify gaps that your study will address
During Data Collection
- Unexpected findings may suggest new relationships
- Keep notes on potential framework modifications
During Analysis
- Your framework guides analysis, but findings may challenge it
- Discuss discrepancies between expected and actual relationships
After Completion
- Final framework may differ from initial version
- Both versions can be valuable for future researchers
Frequently Asked Questions
What is the difference between a conceptual framework and a literature review?
A literature review summarizes and synthesizes existing research on your topic. A conceptual framework is a product of that synthesis—it identifies key variables and relationships that emerge from the literature and shows how they apply to your specific study. The literature review informs the framework; the framework organizes and operationalizes insights from the review.
How many variables should a conceptual framework include?
Most effective conceptual frameworks include 5-8 core variables. Including too many variables (10+) creates confusion and makes relationships unclear. Focus on the variables most central to your research questions. Secondary variables can be mentioned in your written explanation without appearing in the visual diagram.
Can I modify my conceptual framework during my research?
Yes, and this is expected. Your conceptual framework should evolve as you conduct your literature review, collect data, and analyze findings. Document these changes and explain your reasoning. Many dissertations include both the initial and final frameworks to show intellectual development.
Do I need a conceptual framework for qualitative research?
Yes, though it may look different from quantitative frameworks. In qualitative research, your framework might identify key concepts and their potential relationships, serving as a sensitizing device rather than a hypothesis-testing tool. Some qualitative researchers develop their framework iteratively as themes emerge from data.
How do I create a conceptual framework diagram?
Start with boxes representing your variables and arrows showing relationships. Use consistent shapes (rectangles for variables, arrows for directional relationships). Apply color coding for different variable types. Keep the design clean with adequate spacing. Tools like PowerPoint, Lucidchart, draw.io, or ConceptViz can help create professional diagrams.
What's the relationship between conceptual framework and hypothesis?
Your conceptual framework provides the structure from which hypotheses emerge. Each relationship arrow in your framework can potentially become a testable hypothesis. The framework shows the 'big picture' of expected relationships, while hypotheses are specific, testable predictions about those relationships.
Should my conceptual framework include theories?
Your conceptual framework should be grounded in theory, but the visual diagram typically shows variables and relationships rather than naming theories directly. The theoretical foundation belongs in your written explanation, where you justify each relationship by referencing supporting theories and research.
How do I know if my conceptual framework is good enough?
A strong conceptual framework: (1) directly addresses your research questions, (2) includes clearly defined variables, (3) shows specific, justified relationships, (4) is grounded in existing literature, (5) is visually clear and understandable, and (6) guides your methodology. Get feedback from advisors and peers to validate your framework.
Conclusion
A well-constructed conceptual framework transforms your research from a collection of ideas into a coherent, defensible study. It demonstrates to your committee that you understand the theoretical landscape and have a clear plan for investigation.
Key takeaways:
- Start with your research questions — your framework should directly address them
- Ground it in literature — every relationship needs theoretical justification
- Keep it focused — 5-8 variables are usually sufficient
- Visualize clearly — a good diagram communicates instantly
- Iterate as you learn — frameworks evolve with your understanding
Remember: your conceptual framework isn't just a requirement to check off—it's a thinking tool that clarifies your research and guides your methodology.
Additional Resources
- USC Libraries: Conceptual Framework Guide
- How to Write a Research Manuscript
- How to Make Figures for Nature/Science Journals
- Scientific Color Palette Guide
- Best Fonts for Scientific Figures
Ready to create your conceptual framework diagram? Try ConceptViz to generate professional research visuals from simple text descriptions.
Categorías
Más Publicaciones
")
How to Illustrate Science: Methods, Tools & Examples (2026)
Learn 8 proven ways to illustrate science for research papers, posters, and presentations. Covers diagrams, infographics, graphical abstracts, and more.

How to Create Science Animations for PowerPoint: Complete Guide for Researchers
Learn to create engaging scientific animations in PowerPoint with zero budget. Includes step-by-step tutorials, free tools comparison, and best practices for molecular biology, chemistry, and physics presentations.

7 Free BioRender Alternatives 2026: Tested for Science & Research
7 free BioRender alternatives tested for scientific illustration — pricing, quality, ease of use compared. Best picks for researchers, teachers, and students.