Mapping Diagram Generator Function & Domain-Range
Make a mapping diagram online — type your ordered pairs and get a clean domain-to-range diagram with arrows, plus an instant check of whether the relation is a function (one-to-one or many-to-one). Free SVG/PNG download, with an AI mode for annotated illustrations.
Mapping Diagram Examples
Functions, non-functions, domain & range — drawn and checked by the exact engine
One-to-One Function
Every input maps to exactly one output and no two inputs share an output — a one-to-one (injective) function.
Many-to-One (y = x²)
For y = x², both −2 and 2 map to 4. It is still a function — each input has just one output.
Not a Function
Input 1 has two arrows (to 2 and 3), so this relation fails the function test.
Domain and Range
The left oval lists the domain (inputs), the right oval lists the range (outputs).
Mapping Words
Mapping diagrams work with words too — here animals map to their groups.
Identity Mapping (y = x)
The identity function maps every input to itself — a clean one-to-one mapping.
What is a mapping diagram?
A mapping diagram shows the relationship between two sets of values: the domain (the inputs, usually x) on the left and the range (the outputs, usually y) on the right. Each set is drawn inside an oval, and an arrow is drawn from every input to the output it is paired with. Mapping diagrams are used in algebra to picture a relation and, most importantly, to decide whether that relation is a function.
How to tell if a mapping diagram is a function
A relation is a function when every input maps to exactly one output. On a mapping diagram that means each value in the domain has exactly one arrow leaving it. If any input has two or more arrows, the relation is not a function. This tool checks automatically as you type and tells you the verdict — “Function” or “Not a function” — so it doubles as a function-or-not practice checker.
One-to-one and many-to-one functions
- One-to-one (injective): every input has its own output and no two inputs share an output — every arrow lands on a different range value. The line y = 2x is one-to-one.
- Many-to-one: it is still a function, but two or more inputs point to the same output. The squaring function y = x² is many-to-one because −2 and 2 both map to 4.
- Not a function (one-to-many): a single input points to more than one output. This fails the function test — the tool flags it in red.
Reading the domain and range
The domain is the list of all input values — read it straight off the left oval. The range is the list of all output values that actually receive an arrow — read it off the right oval. Because the generator de-duplicates repeated values and keeps them in the order you enter them, the two ovals are exactly the domain and range sets you can write down for the relation.
How to use the mapping diagram generator
- Type your ordered pairs, one per line or comma-separated — for example “1 → 2, 2 → 4, 3 → 6”. You can use ->, →, : or = between the input and output.
- The diagram redraws instantly with the domain on the left, the range on the right, and an arrow for every pair.
- Read the automatic verdict to see whether the relation is a function and, if so, whether it is one-to-one or many-to-one.
- Download a crisp SVG or high-resolution PNG. The diagram is built in your browser and uses no image credits.
When to use the AI illustration mode
The Mapping diagram mode draws exact arrows and runs the function check from your pairs. Switch to AI illustration when you want a richer teaching picture — annotations, a worked explanation of why a relation is or is not a function, colorful sets for younger students, or a side-by-side comparison. Use the precise mode for accuracy and AI for illustration.
常見問題
Related Math Tools
 Education
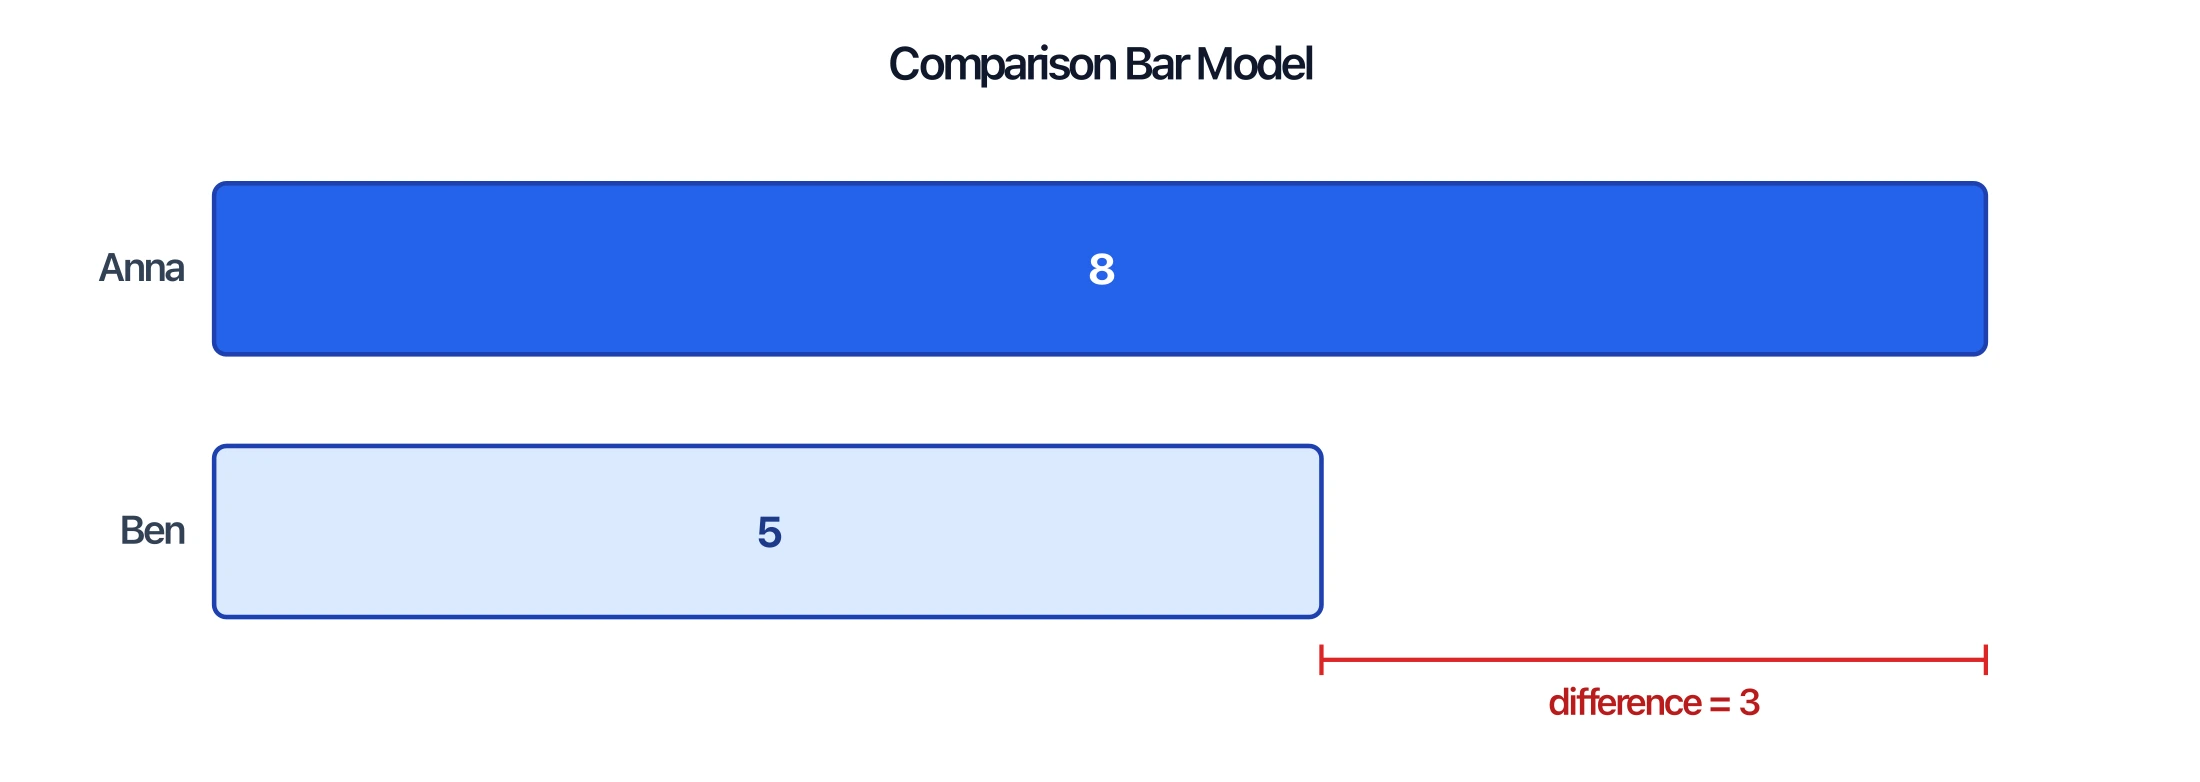
Tape Diagram Generator
Draw to-scale bar models for part-whole, comparison, ratio, and fraction problems.
 Education
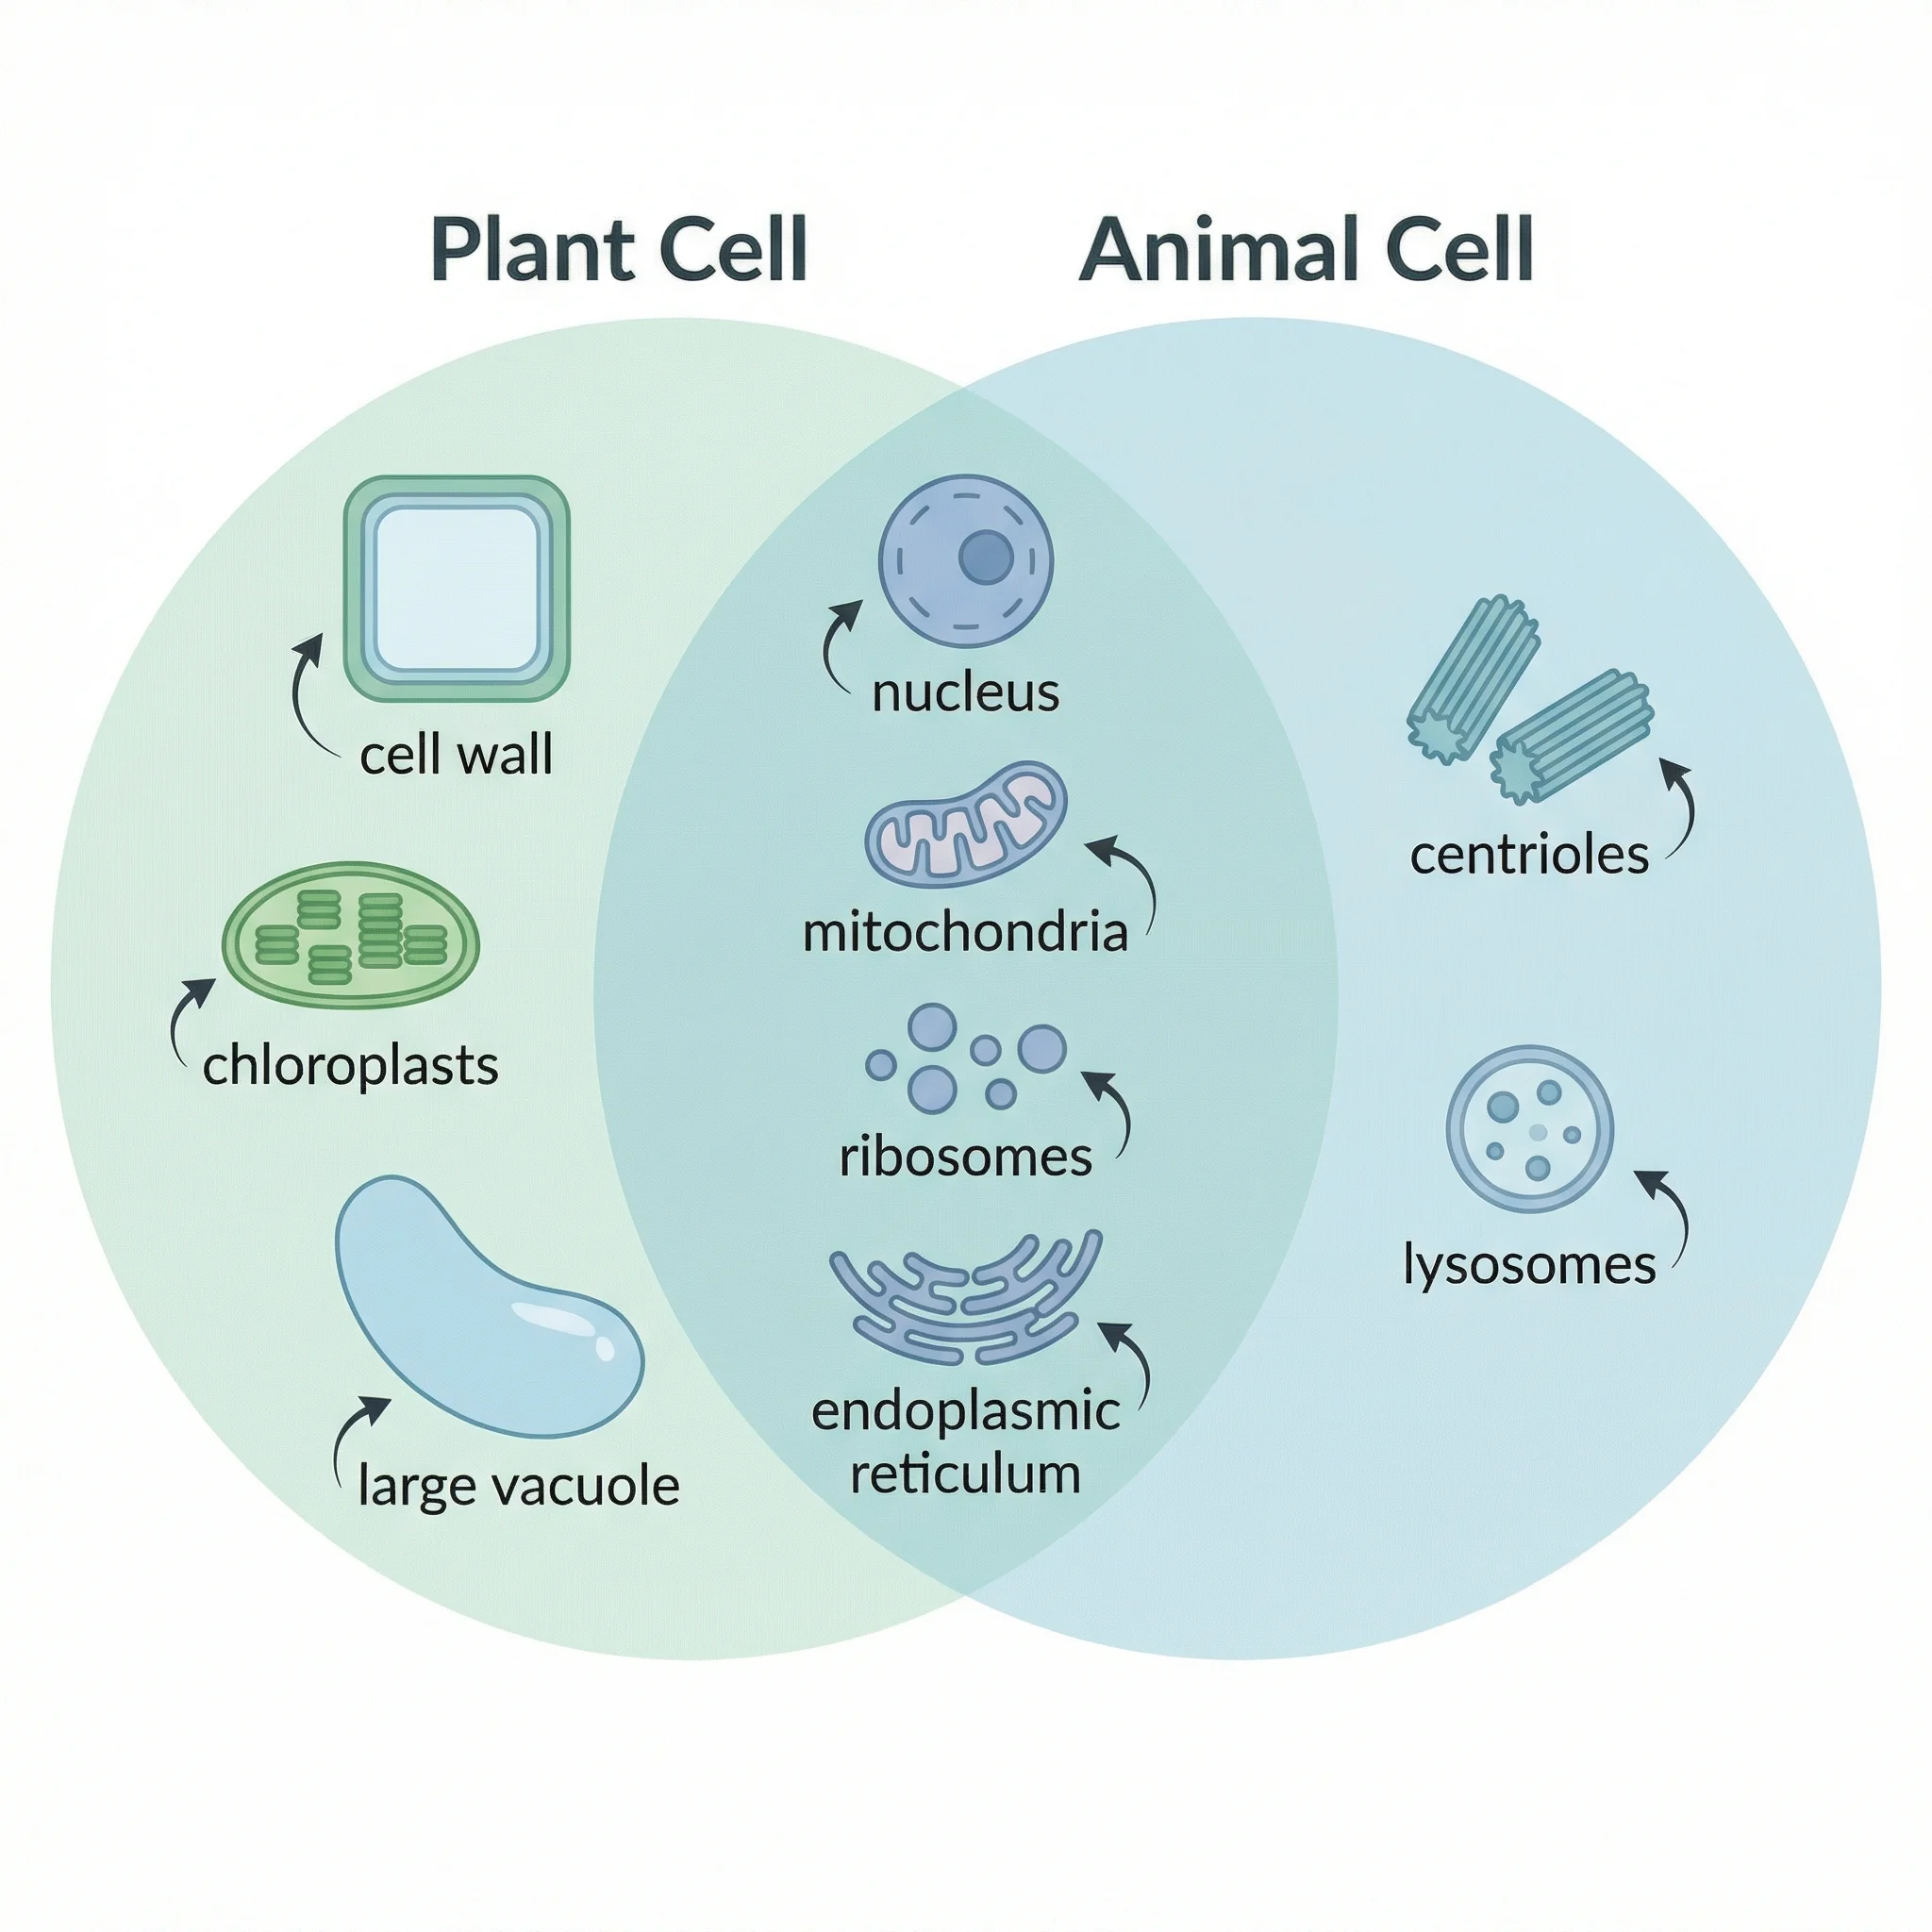
Venn Diagram Generator
Make labeled Venn diagrams to compare and contrast sets, ideas, or categories.
 Education
AI Worksheet Generator
Create printable math worksheets with answer keys from a grade level, topic, and question type.