Блог
Советы преподавателям, сравнение инструментов и руководства по научным диаграммам для преподавателей STEM. Создавайте лучшие учебные материалы с помощью ИИ.
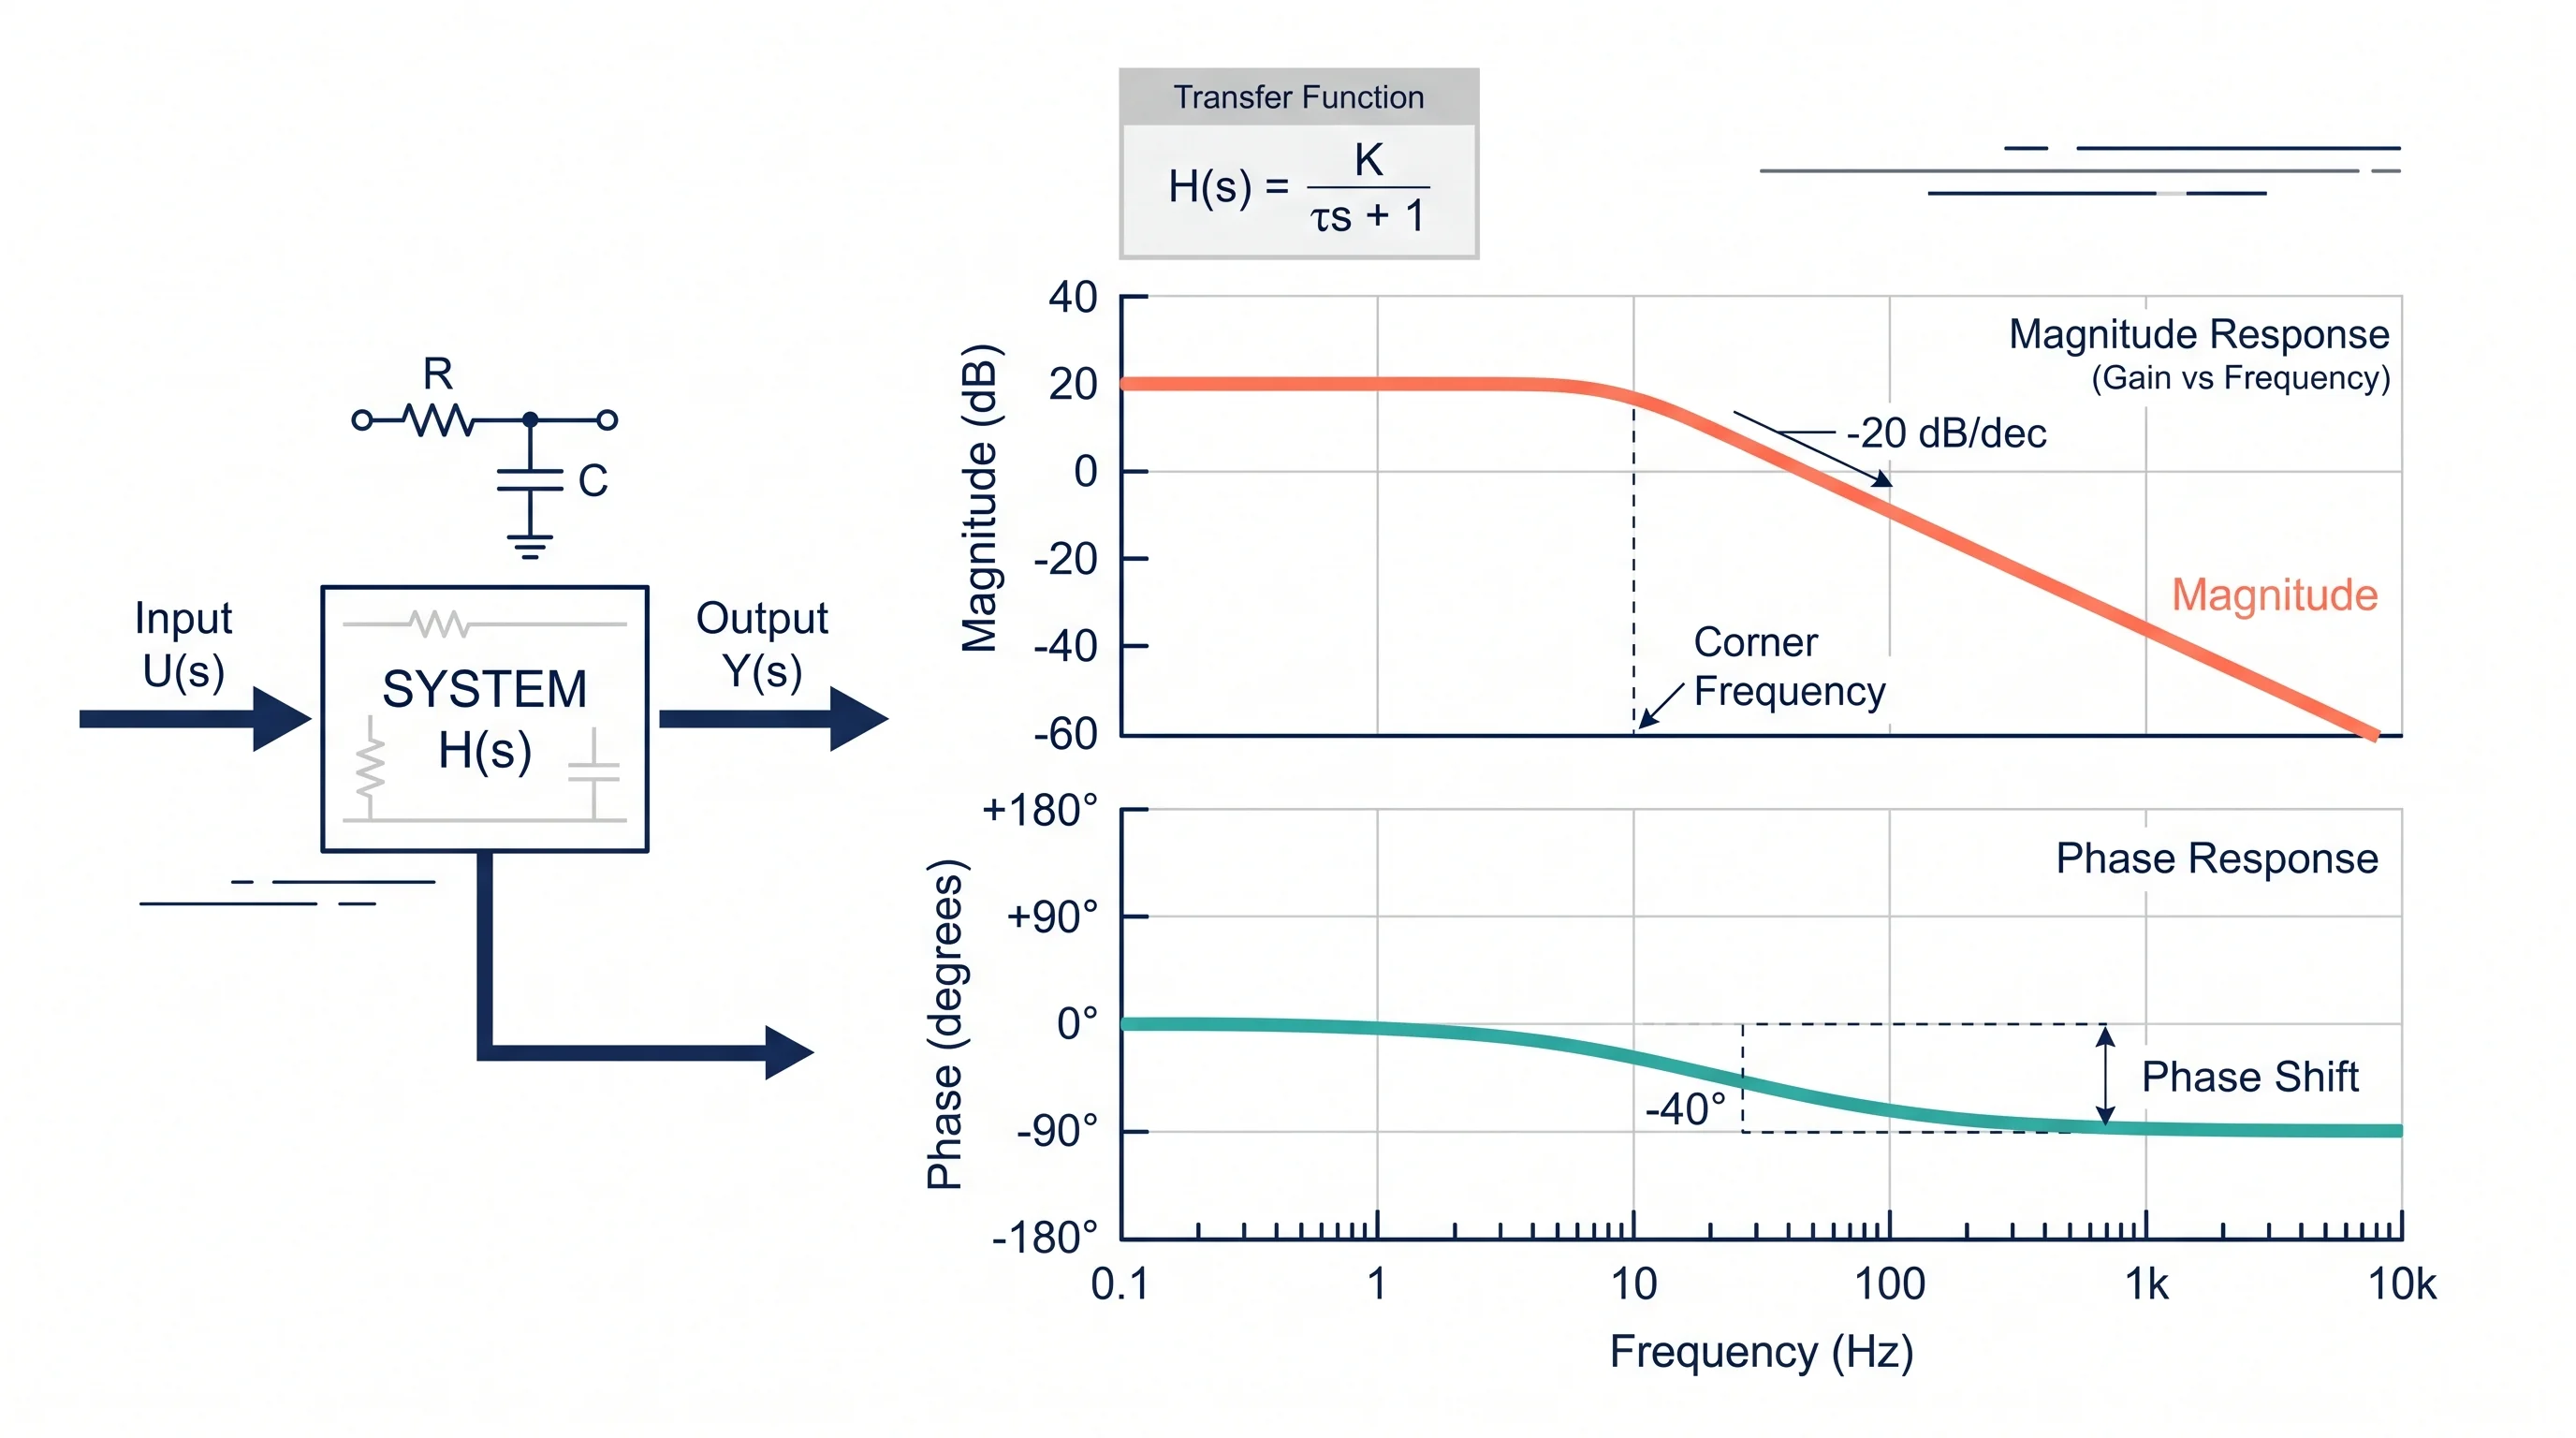
Bode Plot Generator Guide: Make Magnitude and Phase Plots from a Transfer Function
Learn how to use a Bode plot generator, enter transfer functions correctly, read magnitude and phase plots, and avoid common frequency-response mistakes.
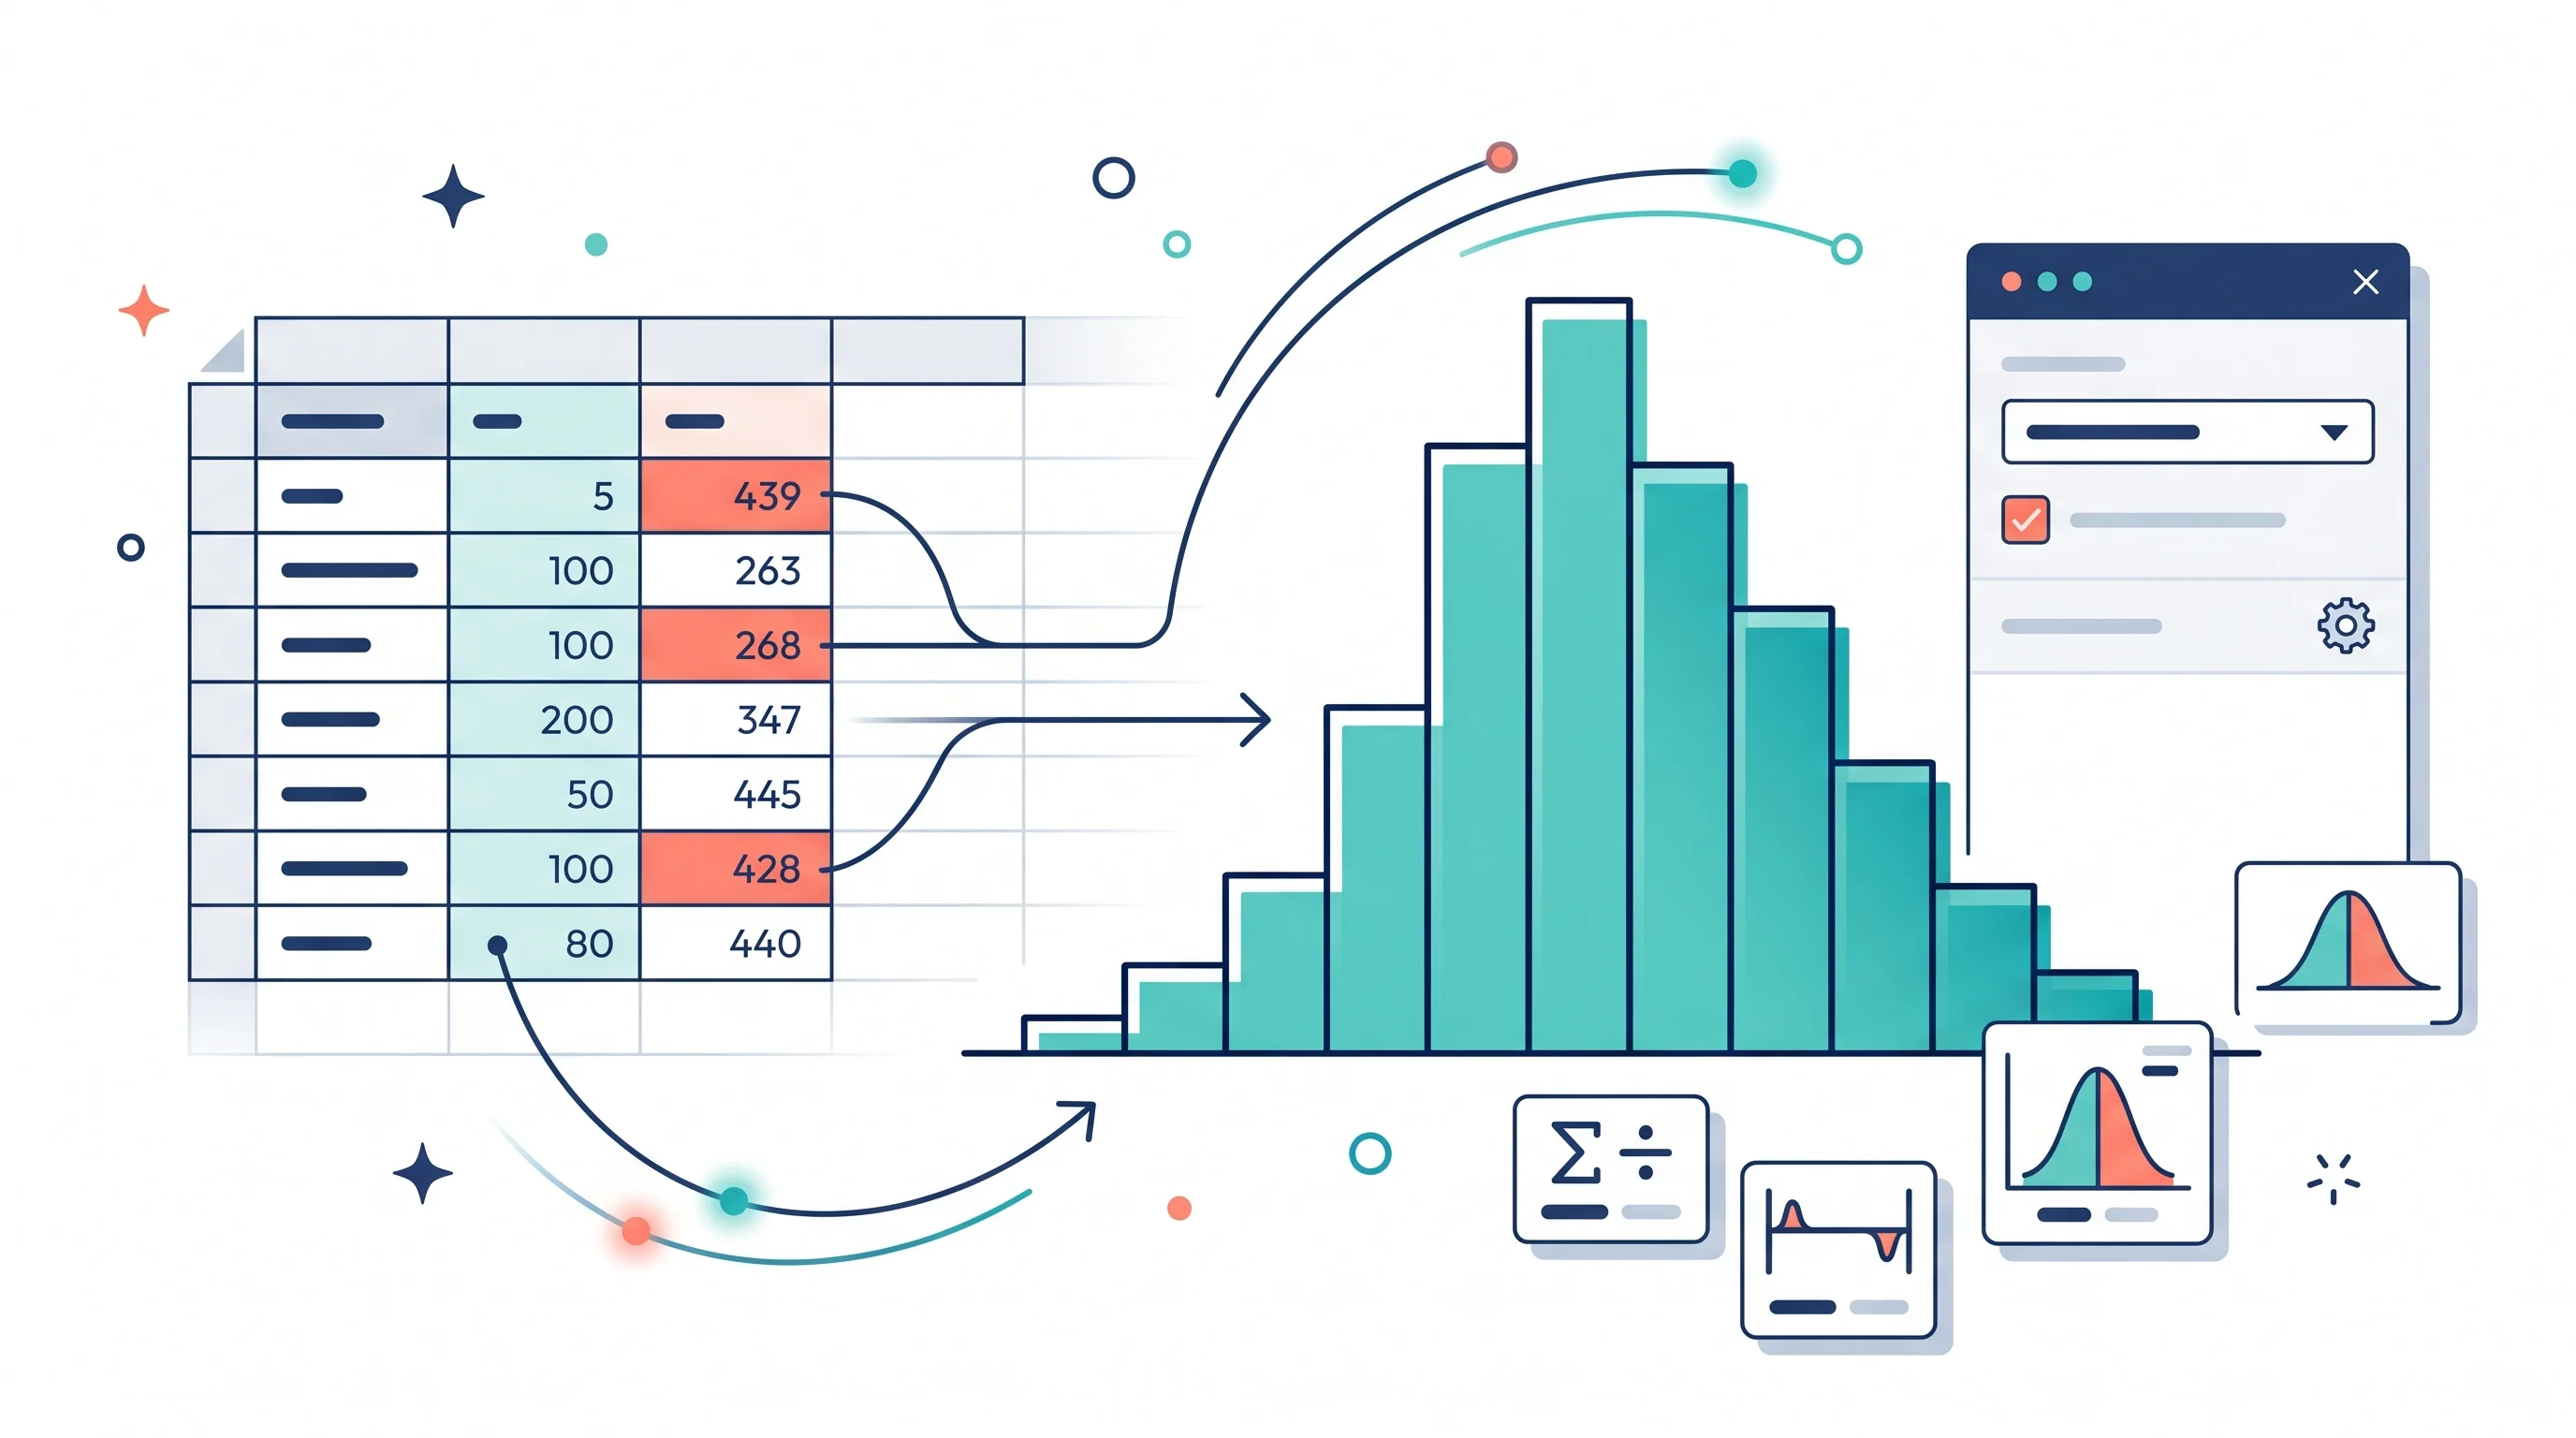
How to Make a Histogram in Google Sheets: Bins, Frequency Tables, and Chart Editor Tips
Learn how to make a histogram in Google Sheets, change bucket size, use frequency tables, fix common chart issues, and format a readable distribution chart.
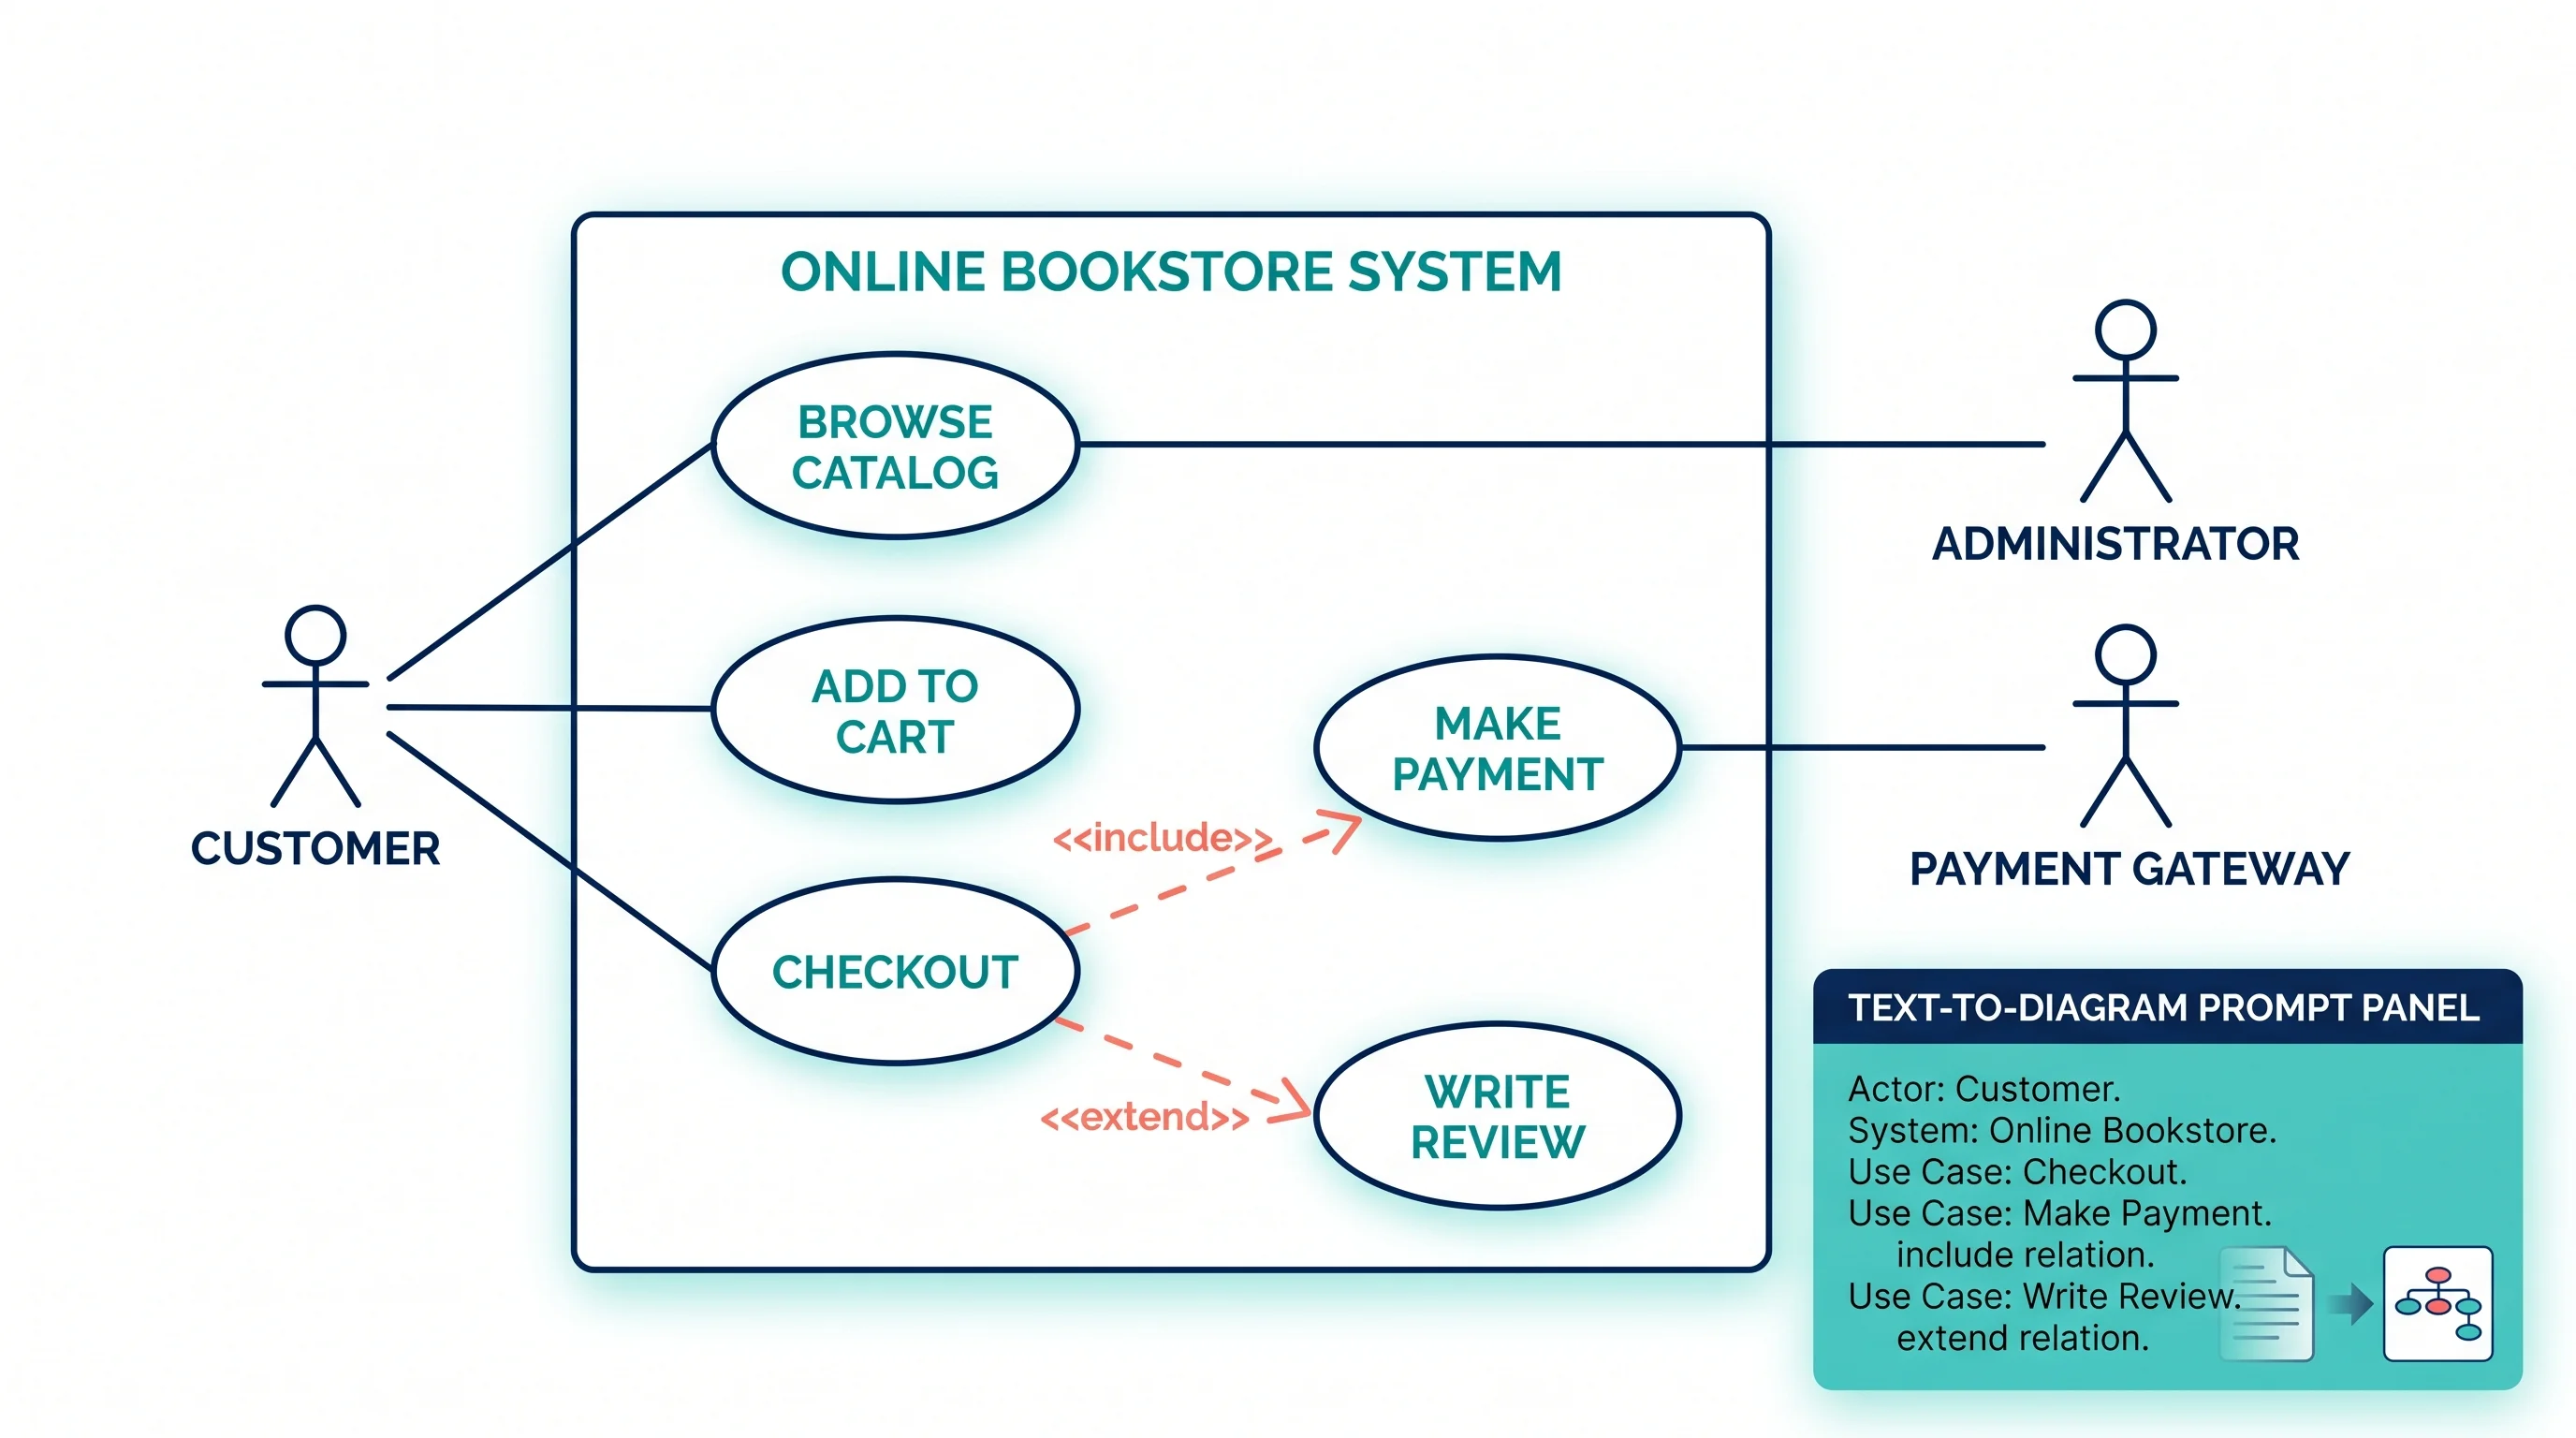
Use Case Diagram Generator Guide: Create UML Use Cases from Text
Learn how to use a use case diagram generator, define actors and system boundaries, write better prompts, and avoid common UML notation mistakes.
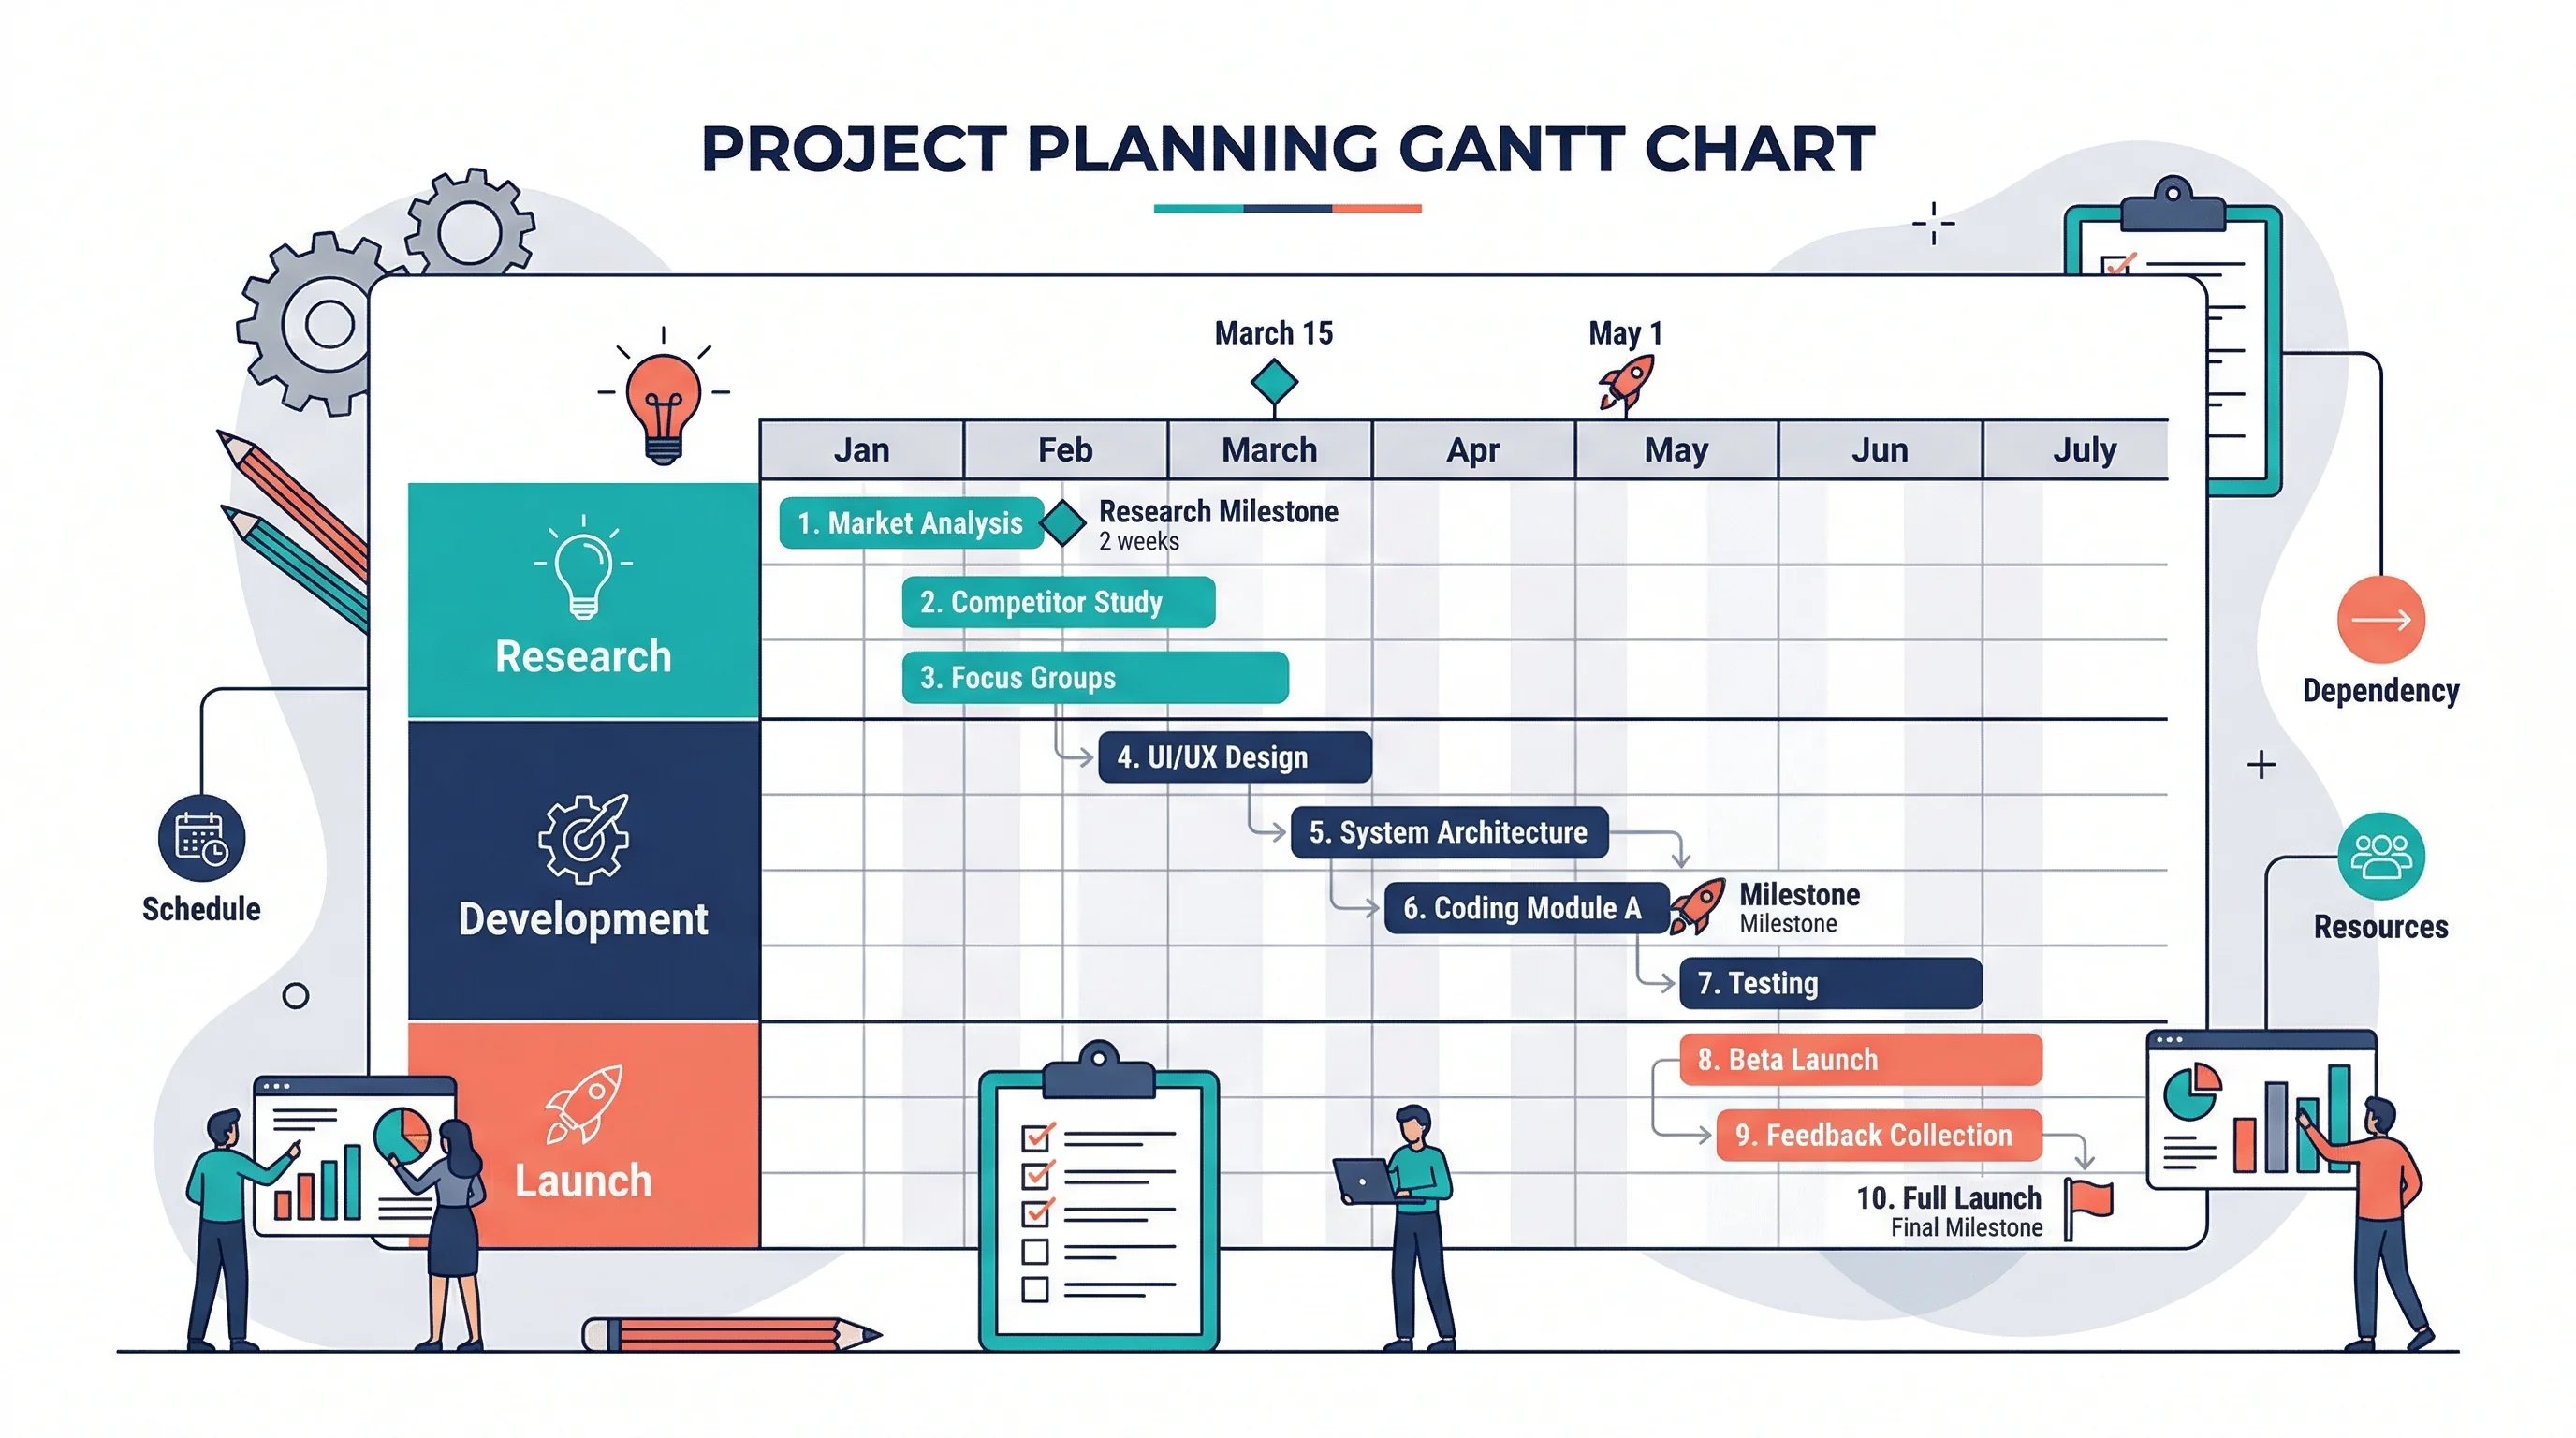
How to Make a Gantt Chart: Step-by-Step Guide for Projects and Research (2026)
Learn how to make a Gantt chart for project plans, research schedules, and launch timelines. Covers Excel, common mistakes, and when to use timeline tools.
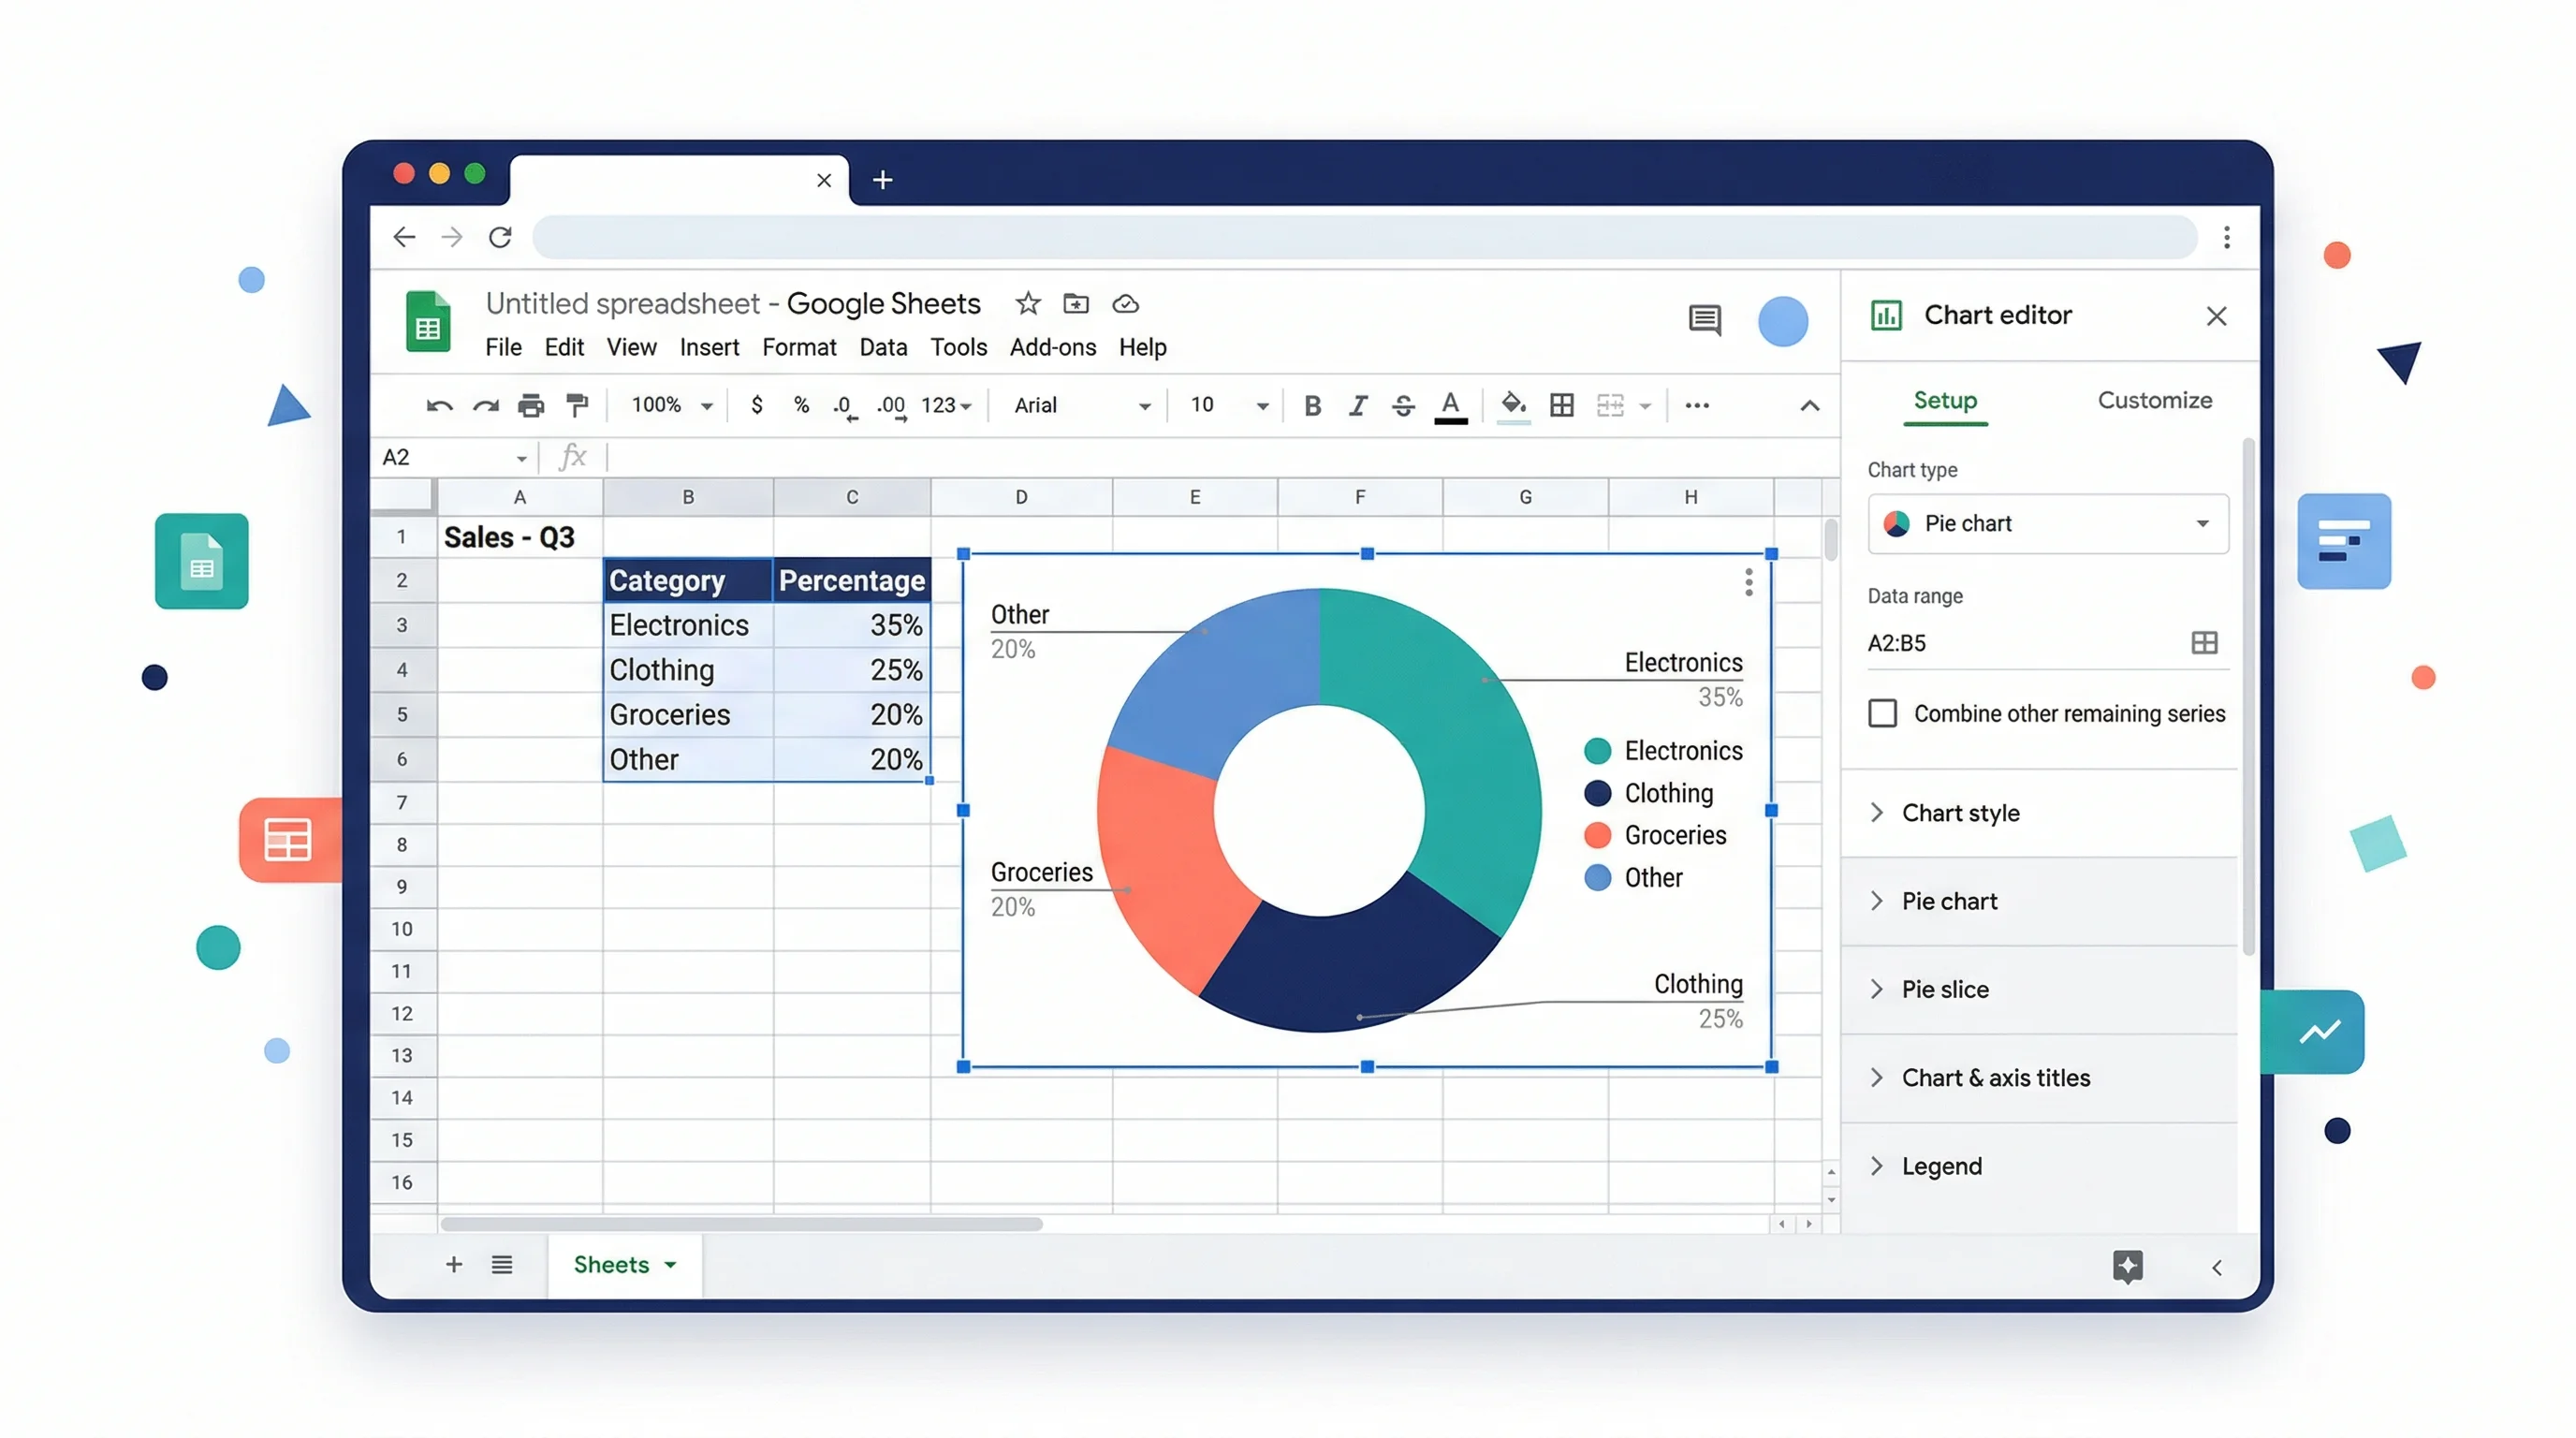
How to Make a Pie Chart in Google Sheets: Step-by-Step Guide (2026)
Learn how to create a pie chart in Google Sheets, summarize messy data, format labels, customize slices, and avoid misleading charts, with official help links.
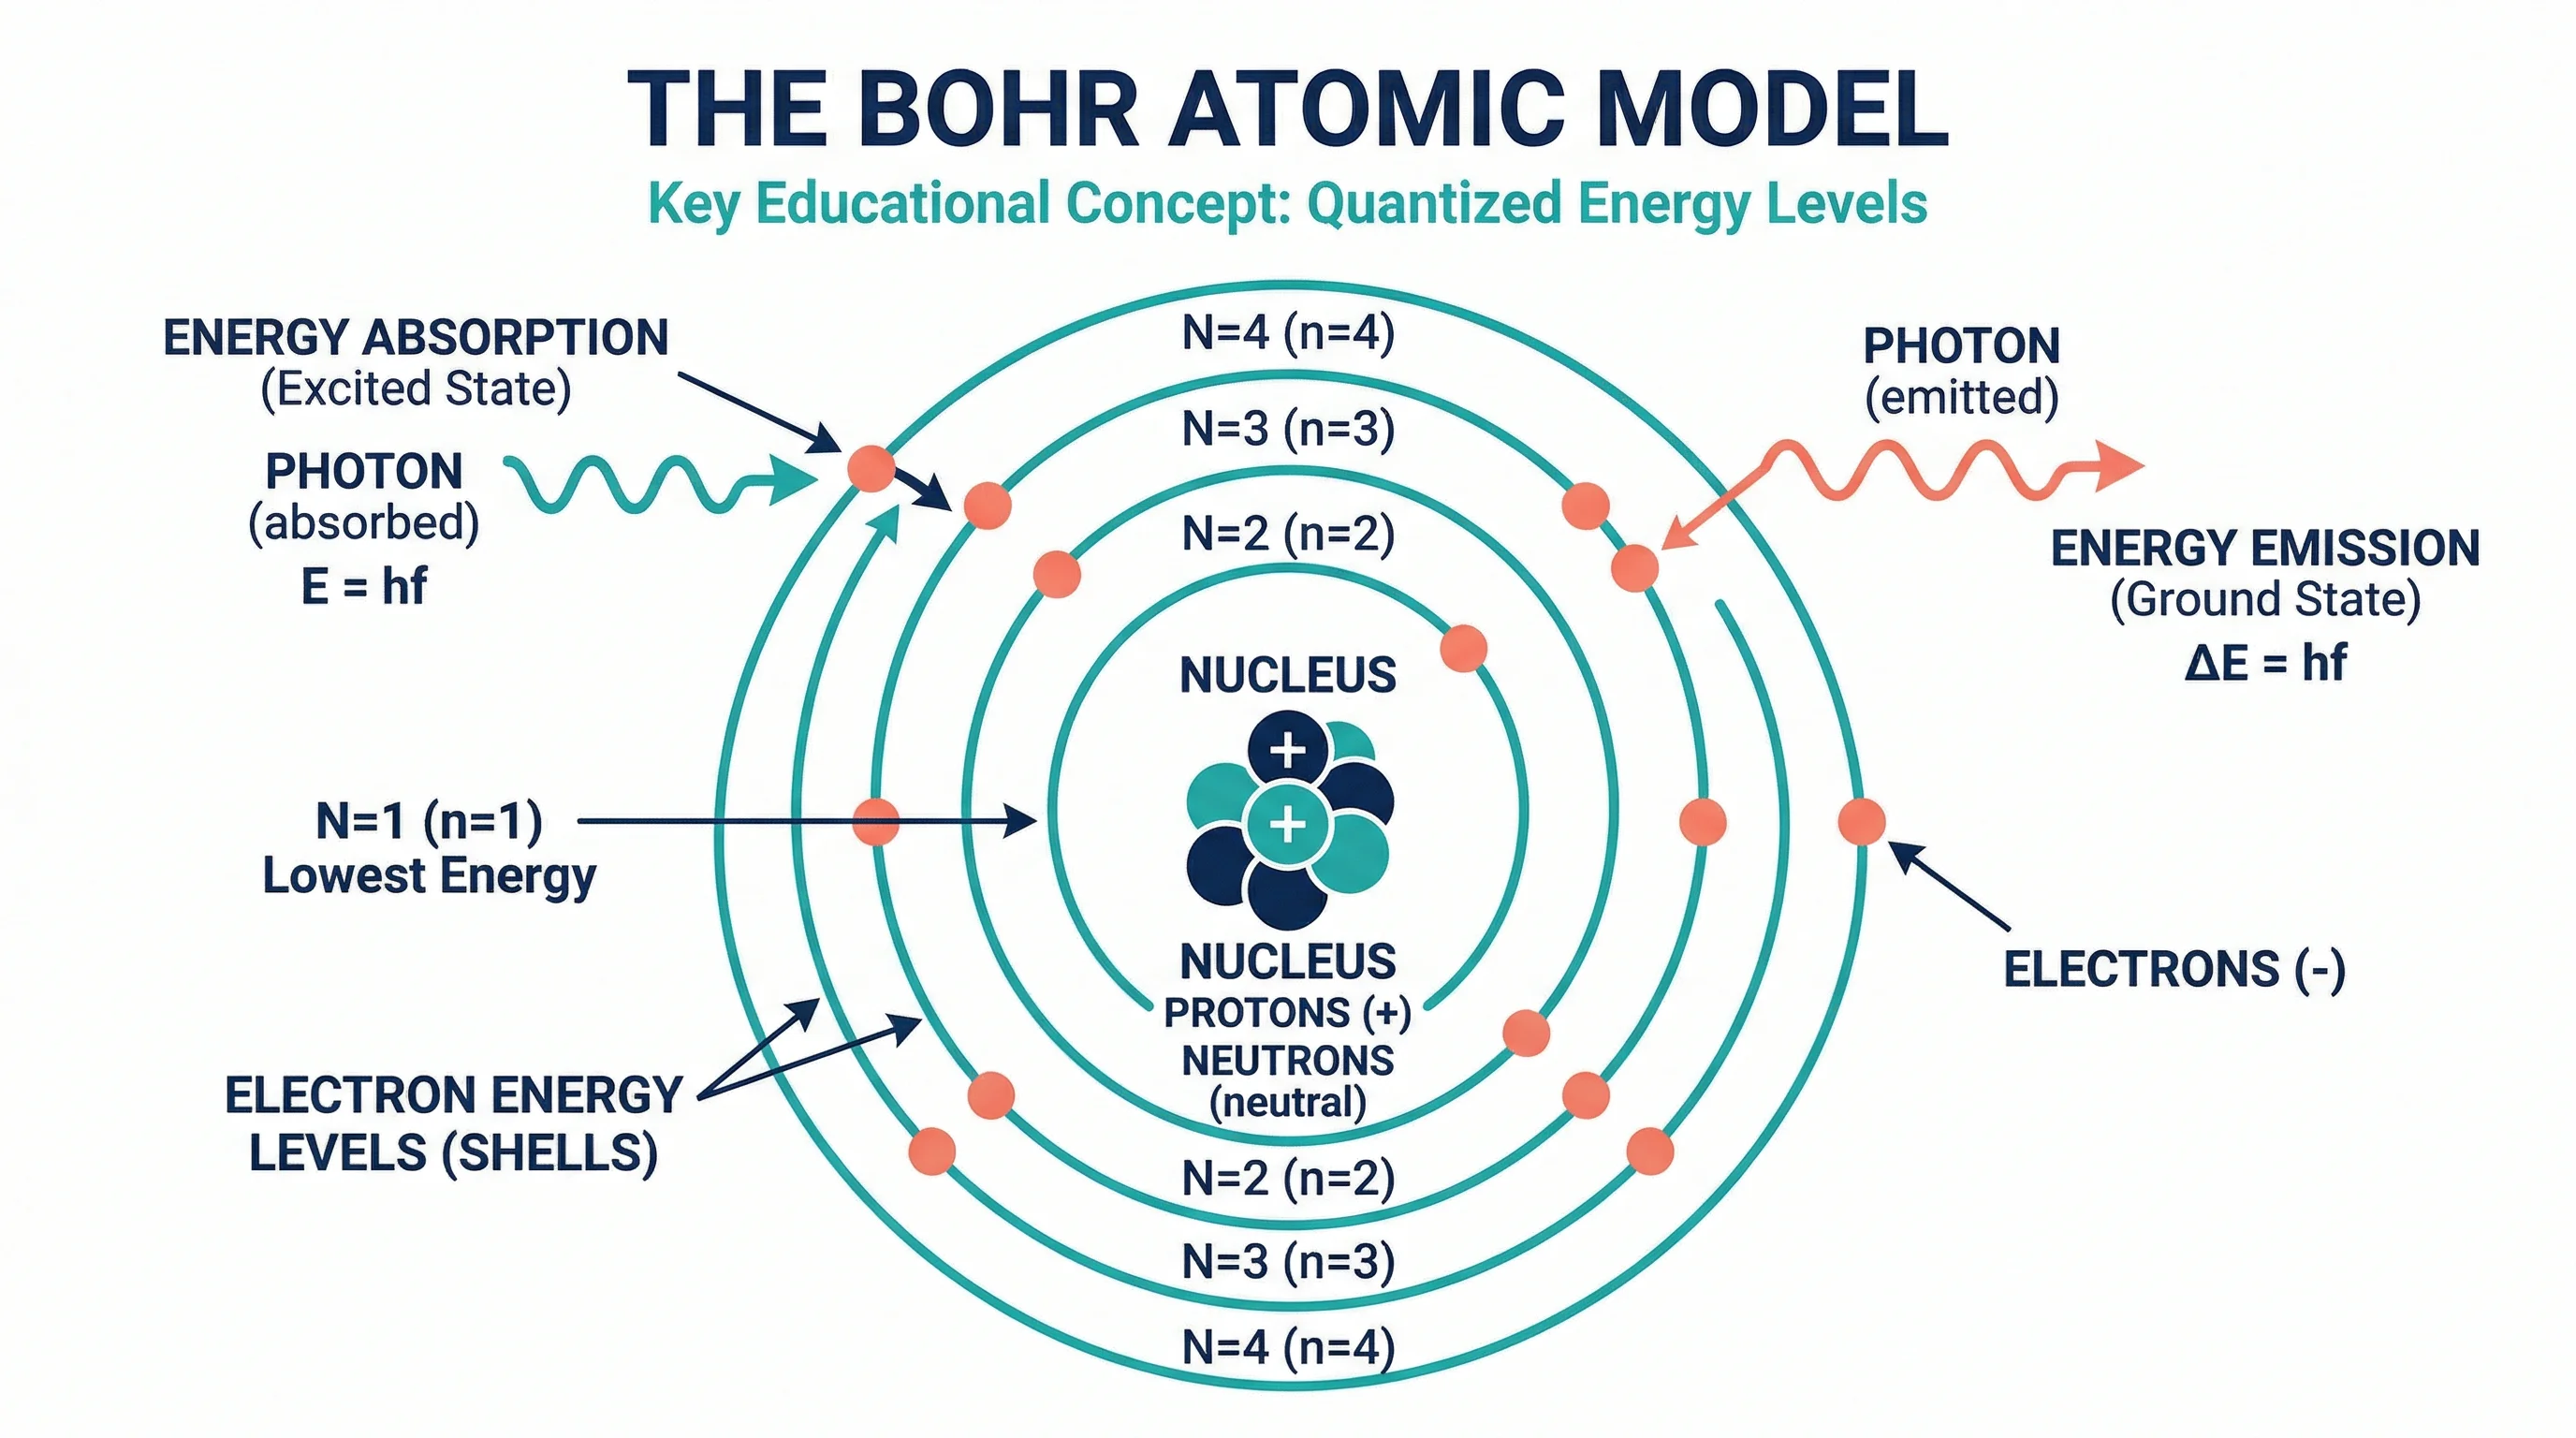
How to Make a Bohr Model: Step-by-Step Guide for Students (2026)
Learn how to draw a Bohr model for any element. Covers electron shell rules, common elements, mistakes to avoid, and where Bohr models break down.