Phase Diagrams Explained: Triple Point & Critical Point
Learn how to read a phase diagram: the solid, liquid, and gas regions, the melting, boiling, and sublimation curves, plus the triple point and critical point, with water and CO2 examples.
A phase diagram is a map of the states of matter. Instead of showing one phase change at a time, it shows every phase of a substance at once — telling you whether it will be a solid, liquid, or gas at any combination of temperature and pressure.
This guide explains how to read a phase diagram: the regions, the curves that separate them, and the two special points — the triple point and the critical point — with examples for water and carbon dioxide.
Quick Answer: What Is a Phase Diagram?
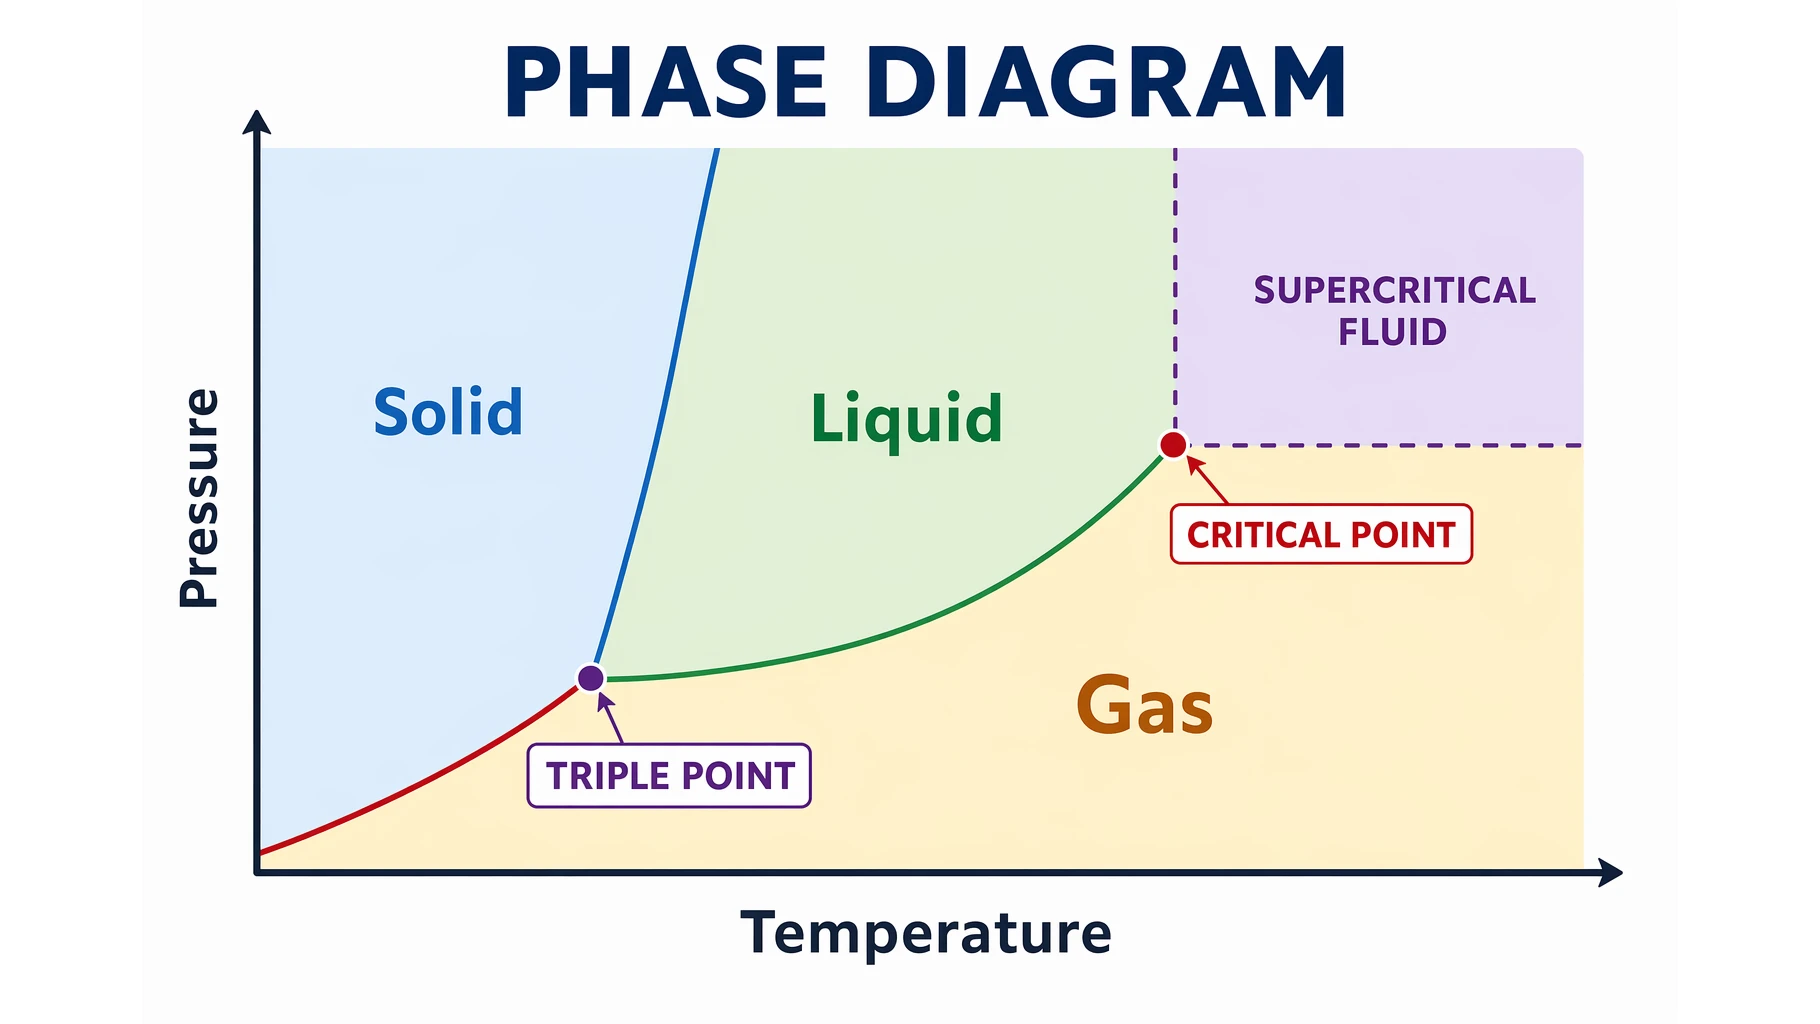
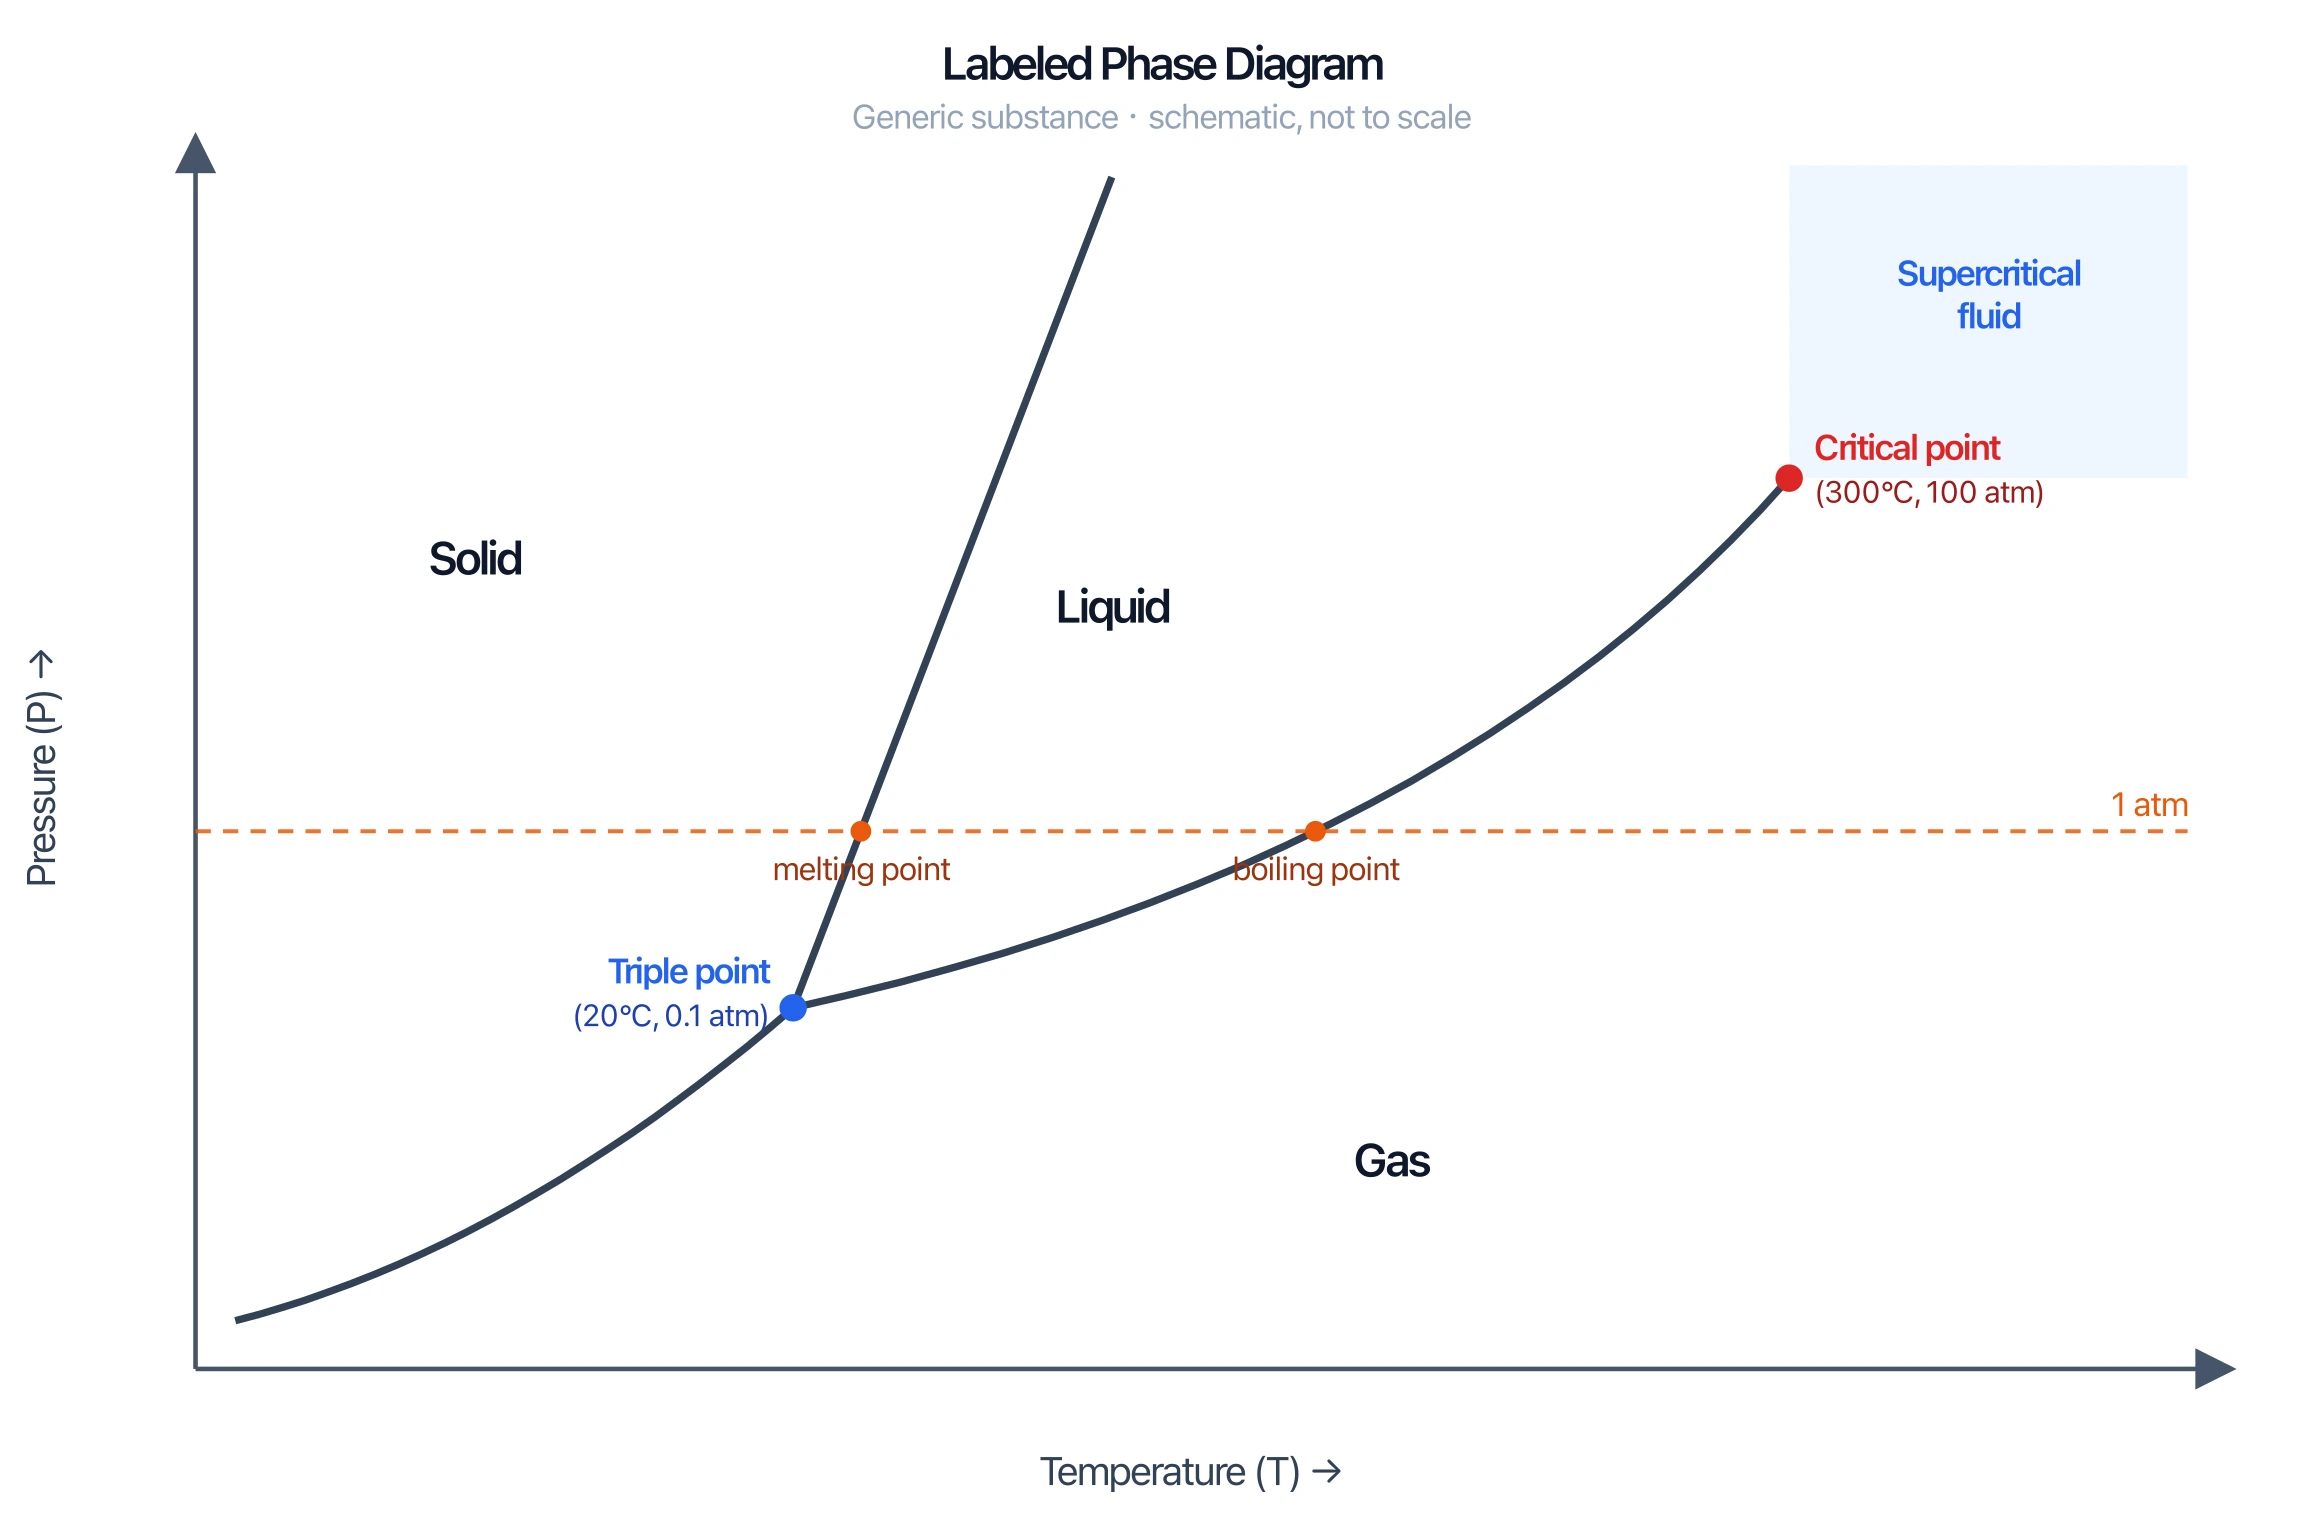
A phase diagram is a graph with temperature on the x-axis and pressure on the y-axis that shows which phase — solid, liquid, or gas — a substance is in at each combination of the two. Lines on the graph mark the conditions where two phases are in equilibrium, and they meet at the triple point.
The Regions and Curves
The diagram is divided into three regions, one for each phase, separated by three curves:
- Solid region (high pressure, low temperature).
- Liquid region (moderate pressure and temperature).
- Gas region (low pressure, high temperature).
- Fusion curve — the solid/liquid boundary (melting and freezing).
- Vaporization curve — the liquid/gas boundary (boiling and condensing).
- Sublimation curve — the solid/gas boundary (subliming and depositing).
Anywhere on a curve, the two neighboring phases coexist in equilibrium. Crossing a curve is a phase change.
Phase Diagram Generator
Create labeled phase diagrams for water, CO2, and generic substances with triple and critical points, then download them free as SVG or PNG.
Make a phase diagram ->The Triple Point
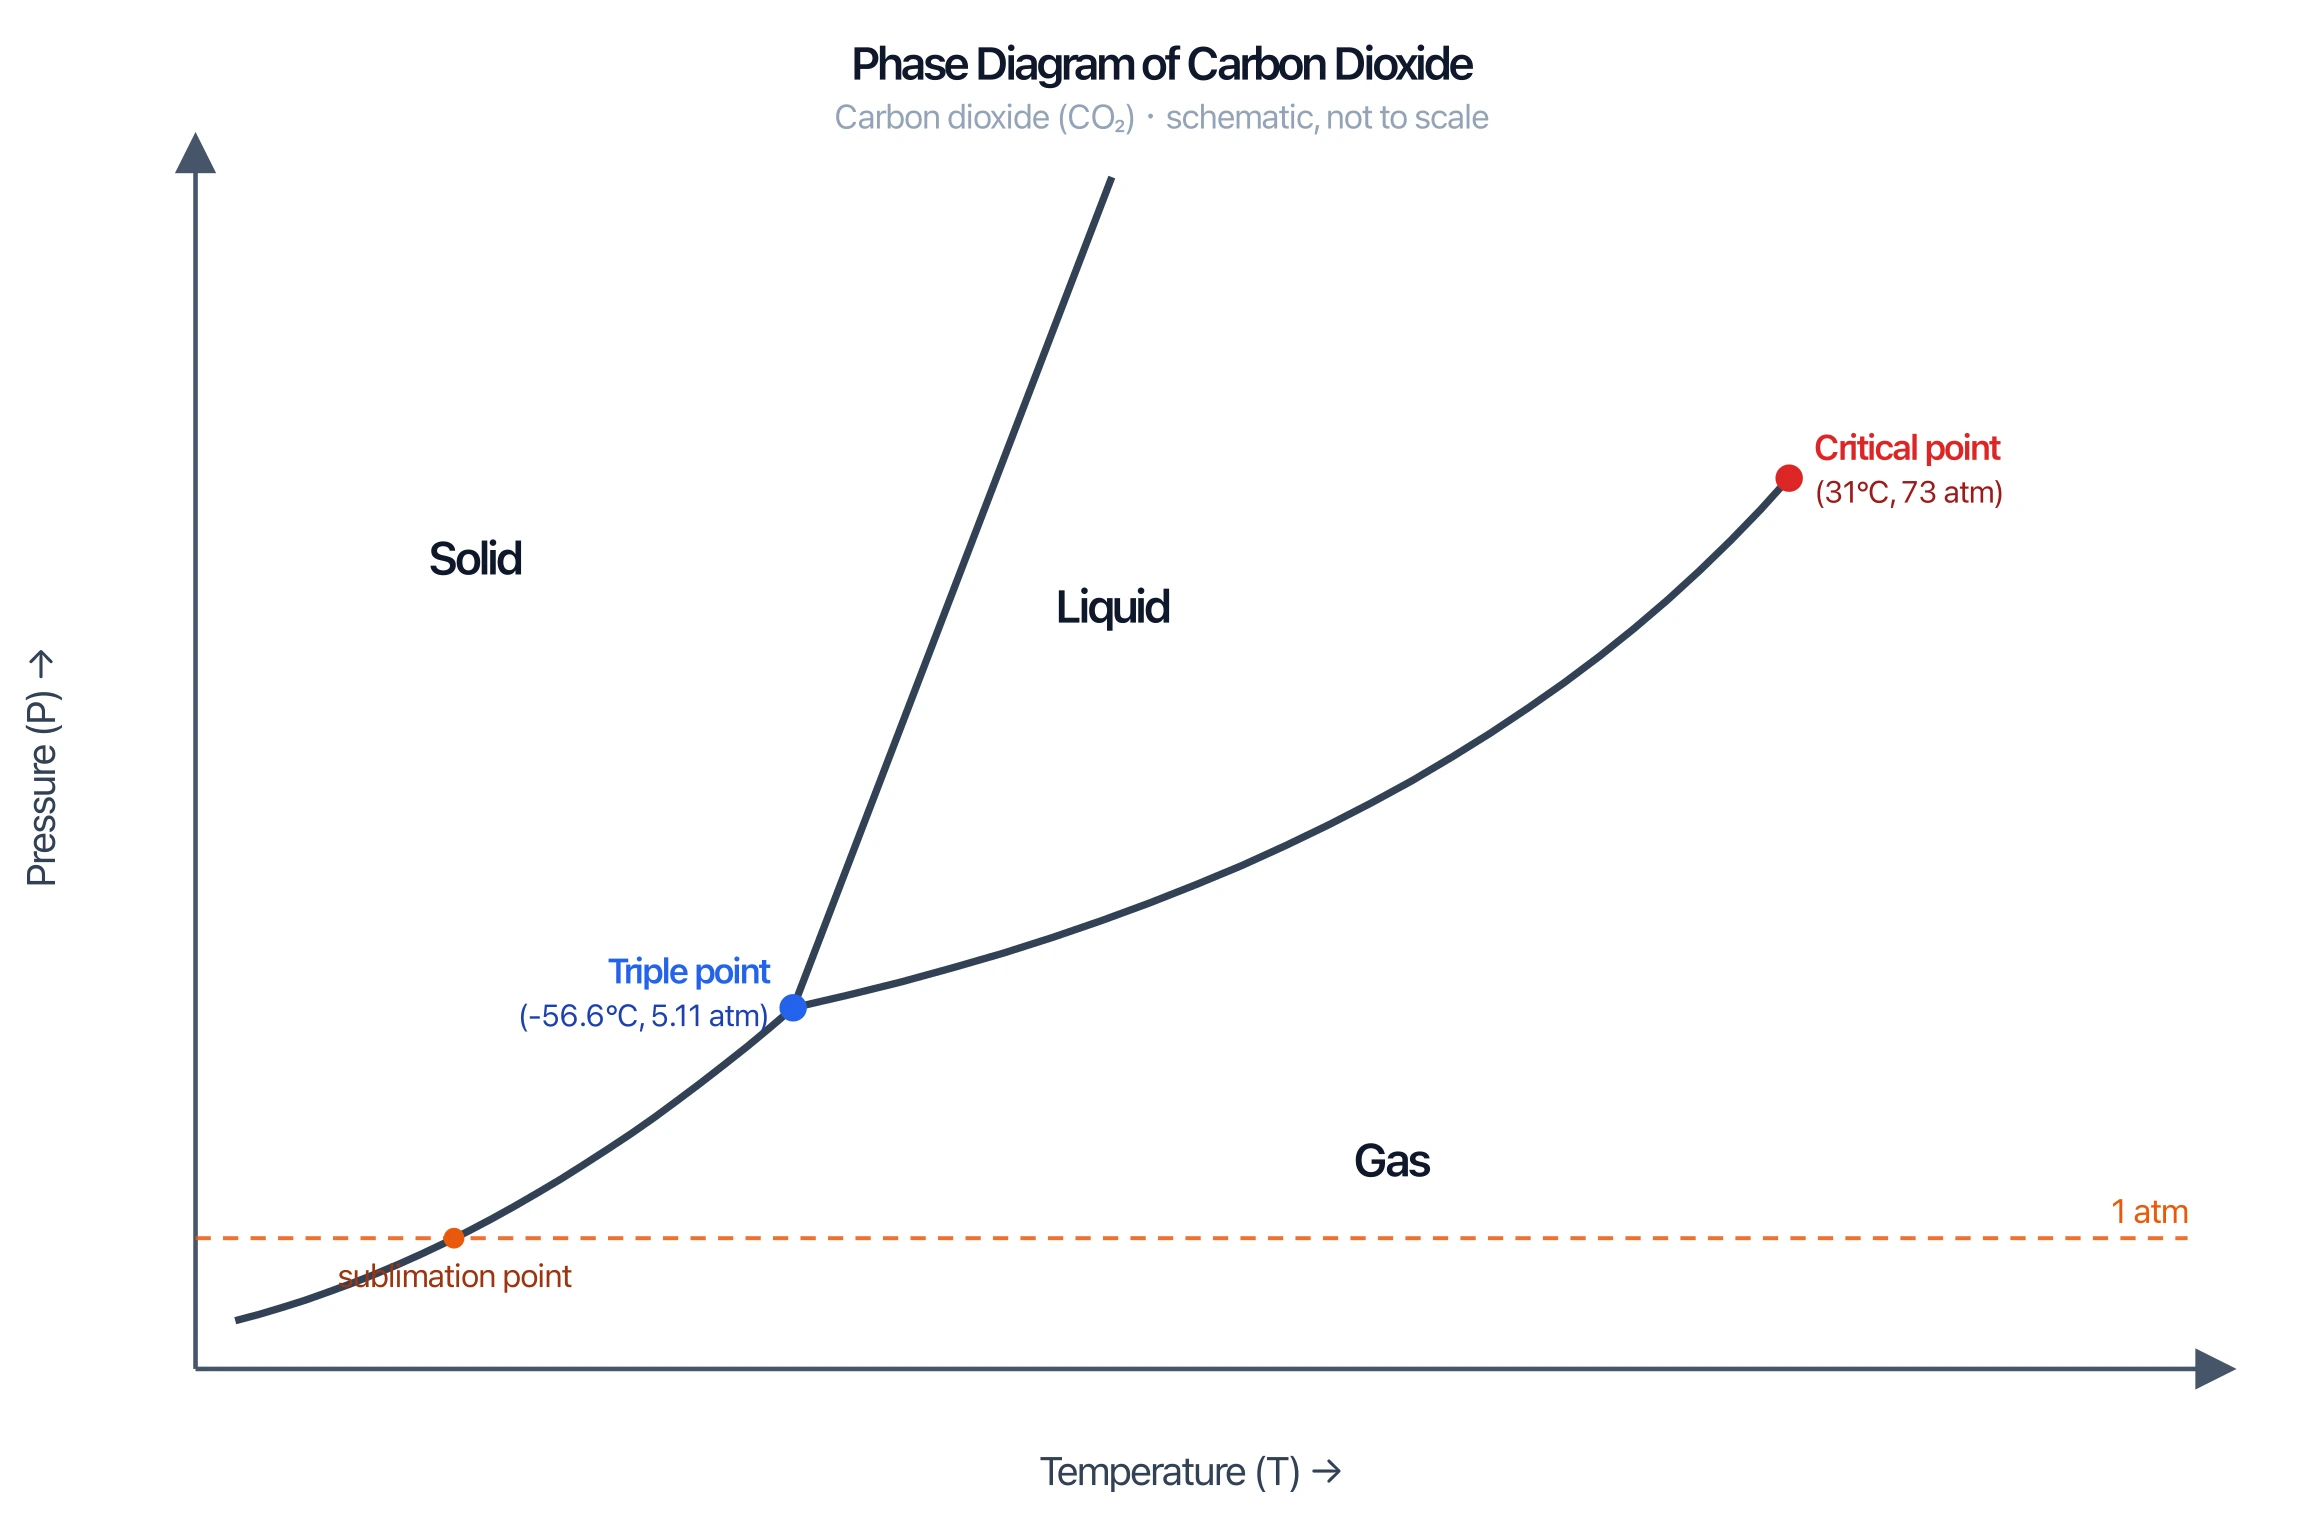
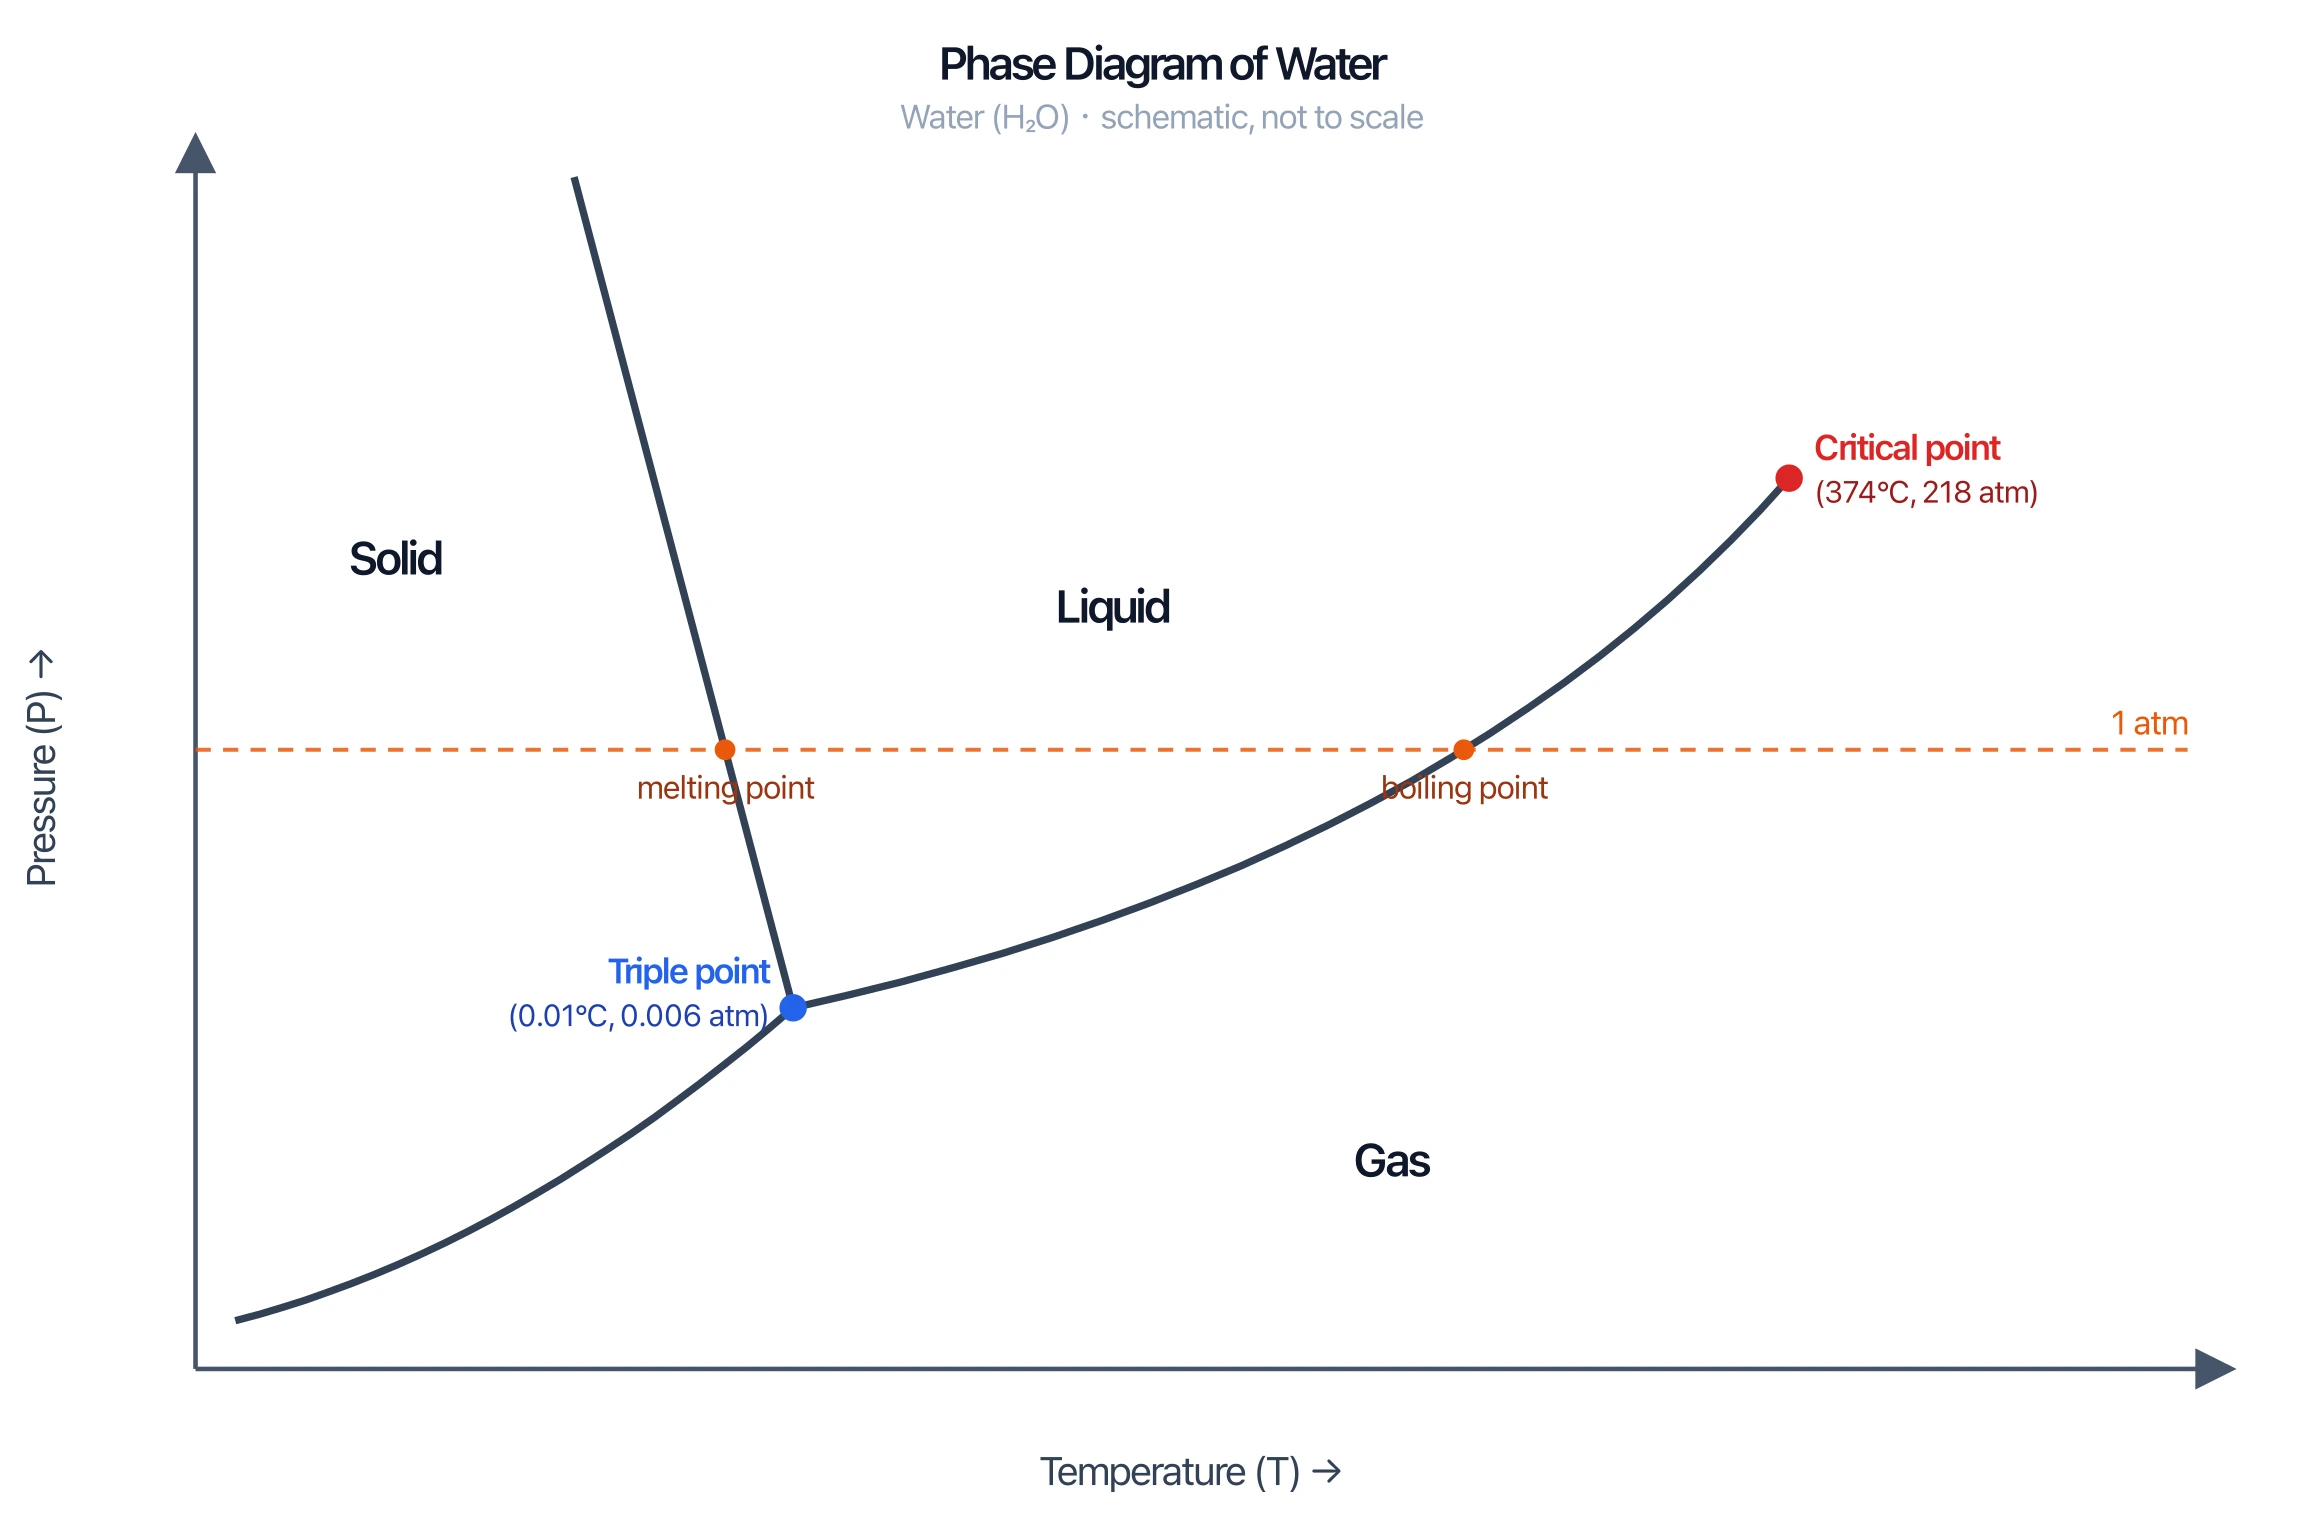
The triple point is the single temperature and pressure where all three curves meet and solid, liquid, and gas coexist in equilibrium at the same time. It is unique to each substance — for water it is 0.01 °C at 0.006 atm (611.66 Pa). Below the triple-point pressure a substance cannot exist as a liquid at all; heating the solid takes it straight to gas (sublimation), which is exactly what dry ice does.
The Critical Point
The critical point sits at the upper end of the vaporization curve. Beyond it — above the critical temperature and pressure — the liquid and gas phases become indistinguishable and the substance is a supercritical fluid, with properties of both. Above the critical temperature you cannot liquefy a gas no matter how hard you compress it.
Water vs Carbon Dioxide
Comparing two substances shows why phase diagrams matter:
- Water has an unusual negatively sloped fusion curve — the solid/liquid line leans left. This is because ice is less dense than liquid water, so increasing pressure can melt ice. Most substances slope the other way.
- Carbon dioxide has its triple point above 1 atm (5.1 atm). That means at ordinary pressure CO₂ has no liquid state — solid CO₂ (dry ice) sublimes straight to gas, which is why it leaves no puddle.
How to Read a Phase Diagram
- Find your point using the temperature and pressure values.
- See which region it lands in — that is the phase.
- Move along a path (heating = right, compressing = up) and note each curve you cross — each crossing is a phase change.
- Check the special points: is your pressure below the triple point (sublimation only) or above the critical point (supercritical)?
Common Mistakes
- Swapping the axes. Temperature is on the x-axis, pressure on the y-axis.
- Assuming every fusion curve slopes right. Water's slopes left because ice floats.
- Confusing the triple point and the critical point. Triple point = all three phases coexist; critical point = liquid and gas become one.
- Forgetting sublimation. Below the triple-point pressure, solid goes directly to gas.
FAQ
What does a phase diagram show?
It shows which phase (solid, liquid, or gas) a substance is in at any given temperature and pressure, with curves marking where two phases are in equilibrium.
What is the triple point?
The triple point is the unique temperature and pressure at which the solid, liquid, and gas phases of a substance all coexist in equilibrium. For water it is 0.01 °C and 0.006 atm.
What is the critical point?
The critical point is the end of the liquid-gas curve, beyond which liquid and gas are indistinguishable and the substance becomes a supercritical fluid. Above the critical temperature a gas cannot be liquefied by pressure alone.
Why does water have an unusual phase diagram?
Because ice is less dense than liquid water, water's solid-liquid (fusion) curve slopes to the left (negative slope). Increasing pressure can melt ice — the opposite of most substances.
Why does dry ice sublime instead of melting?
Because carbon dioxide's triple point is above 1 atm (about 5.1 atm). At ordinary atmospheric pressure CO₂ has no liquid phase, so solid CO₂ turns directly into gas.
Related Guides
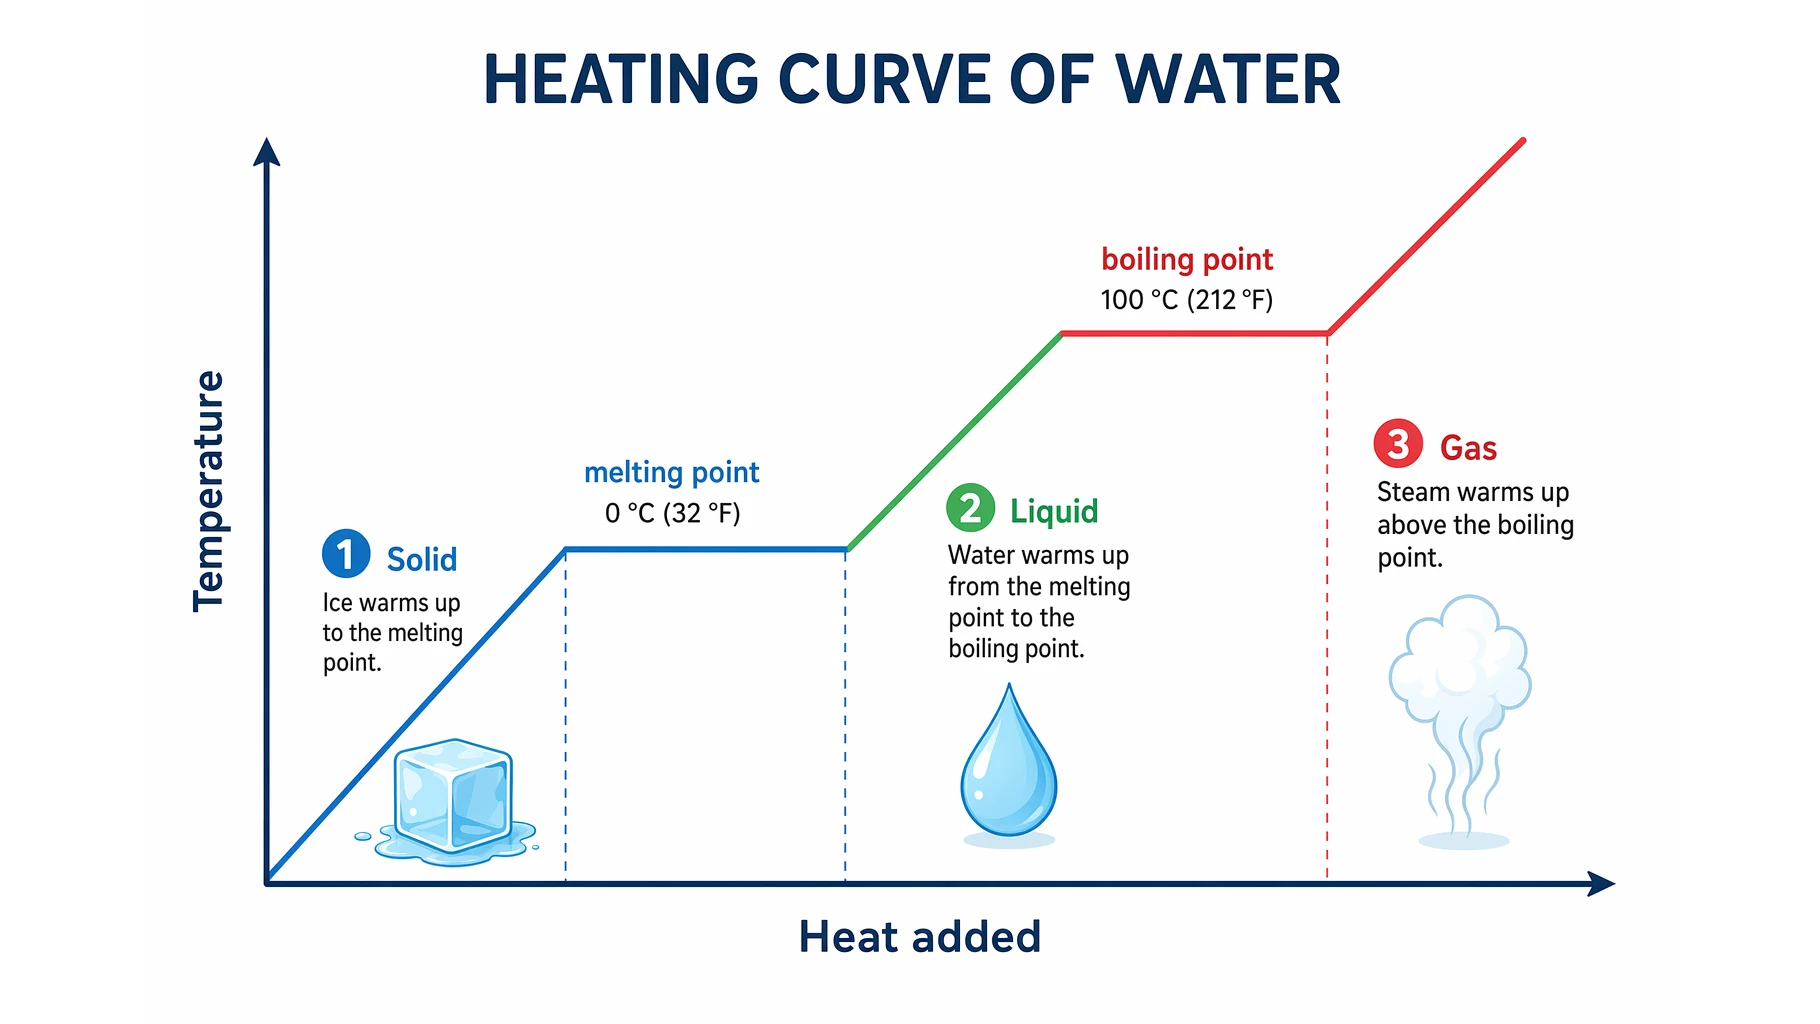
- Heating Curve of Water: The 5 Stages — what happens to temperature and phase as you add heat across a phase change.
- How to Draw a Volcano: Step-by-Step — draw a labeled volcano cross-section showing the magma chamber, conduit, and vent where molten rock reaches the surface.
Further Reading
Catégories
Plus d'articles
Scientific Infographic Design: Complete Guide for Researchers and Scientists
Master the art of creating effective scientific infographics. Learn design principles, data visualization techniques, and best practices for communicating research visually.
BioRender vs ConceptViz: Keep the Seat or Pay Per Figure
Compare BioRender vs ConceptViz in 2026: $35/mo Academic Individual versus credit packs, required citations, and when buying a second seat is the wrong call.
Heating Curve of Water Explained: The 5 Stages
Understand the heating curve of water step by step: what the axes mean, why the plateaus are flat, and how specific heat and latent heat shape each of the five stages.