
Energy Level Diagrams Explained: Electrons, Photons & Spectra
Learn how to read an energy level diagram: electron transitions, absorption and emission of photons, and how the hydrogen spectrum and its series are produced.
An energy level diagram shows the allowed energies of the electrons in an atom — and what happens when they jump between them. Those jumps, called electron transitions, are why atoms absorb and emit light at specific wavelengths, and why each element has its own spectral fingerprint.
This guide explains how to read an energy level diagram: what the levels mean, how absorption and emission work, and how the hydrogen spectrum and its series come from these transitions.
Quick Answer: What Is an Energy Level Diagram?
An energy level diagram is a chart of the allowed energy states of an electron in an atom, drawn as horizontal lines stacked by energy. The lowest line is the ground state; higher lines are excited states. Electrons can only occupy these specific levels, and they move between them by absorbing or emitting a photon whose energy exactly matches the gap.
Why Energy Levels Are Quantized
In the Bohr model, electrons orbit the nucleus only in certain allowed shells, each with a fixed energy. Because the energies are quantized (discrete, not continuous), an electron cannot have an energy between two levels. Energies are written as negative values, with the ground state most negative and the levels getting closer together as they approach zero (ionization).
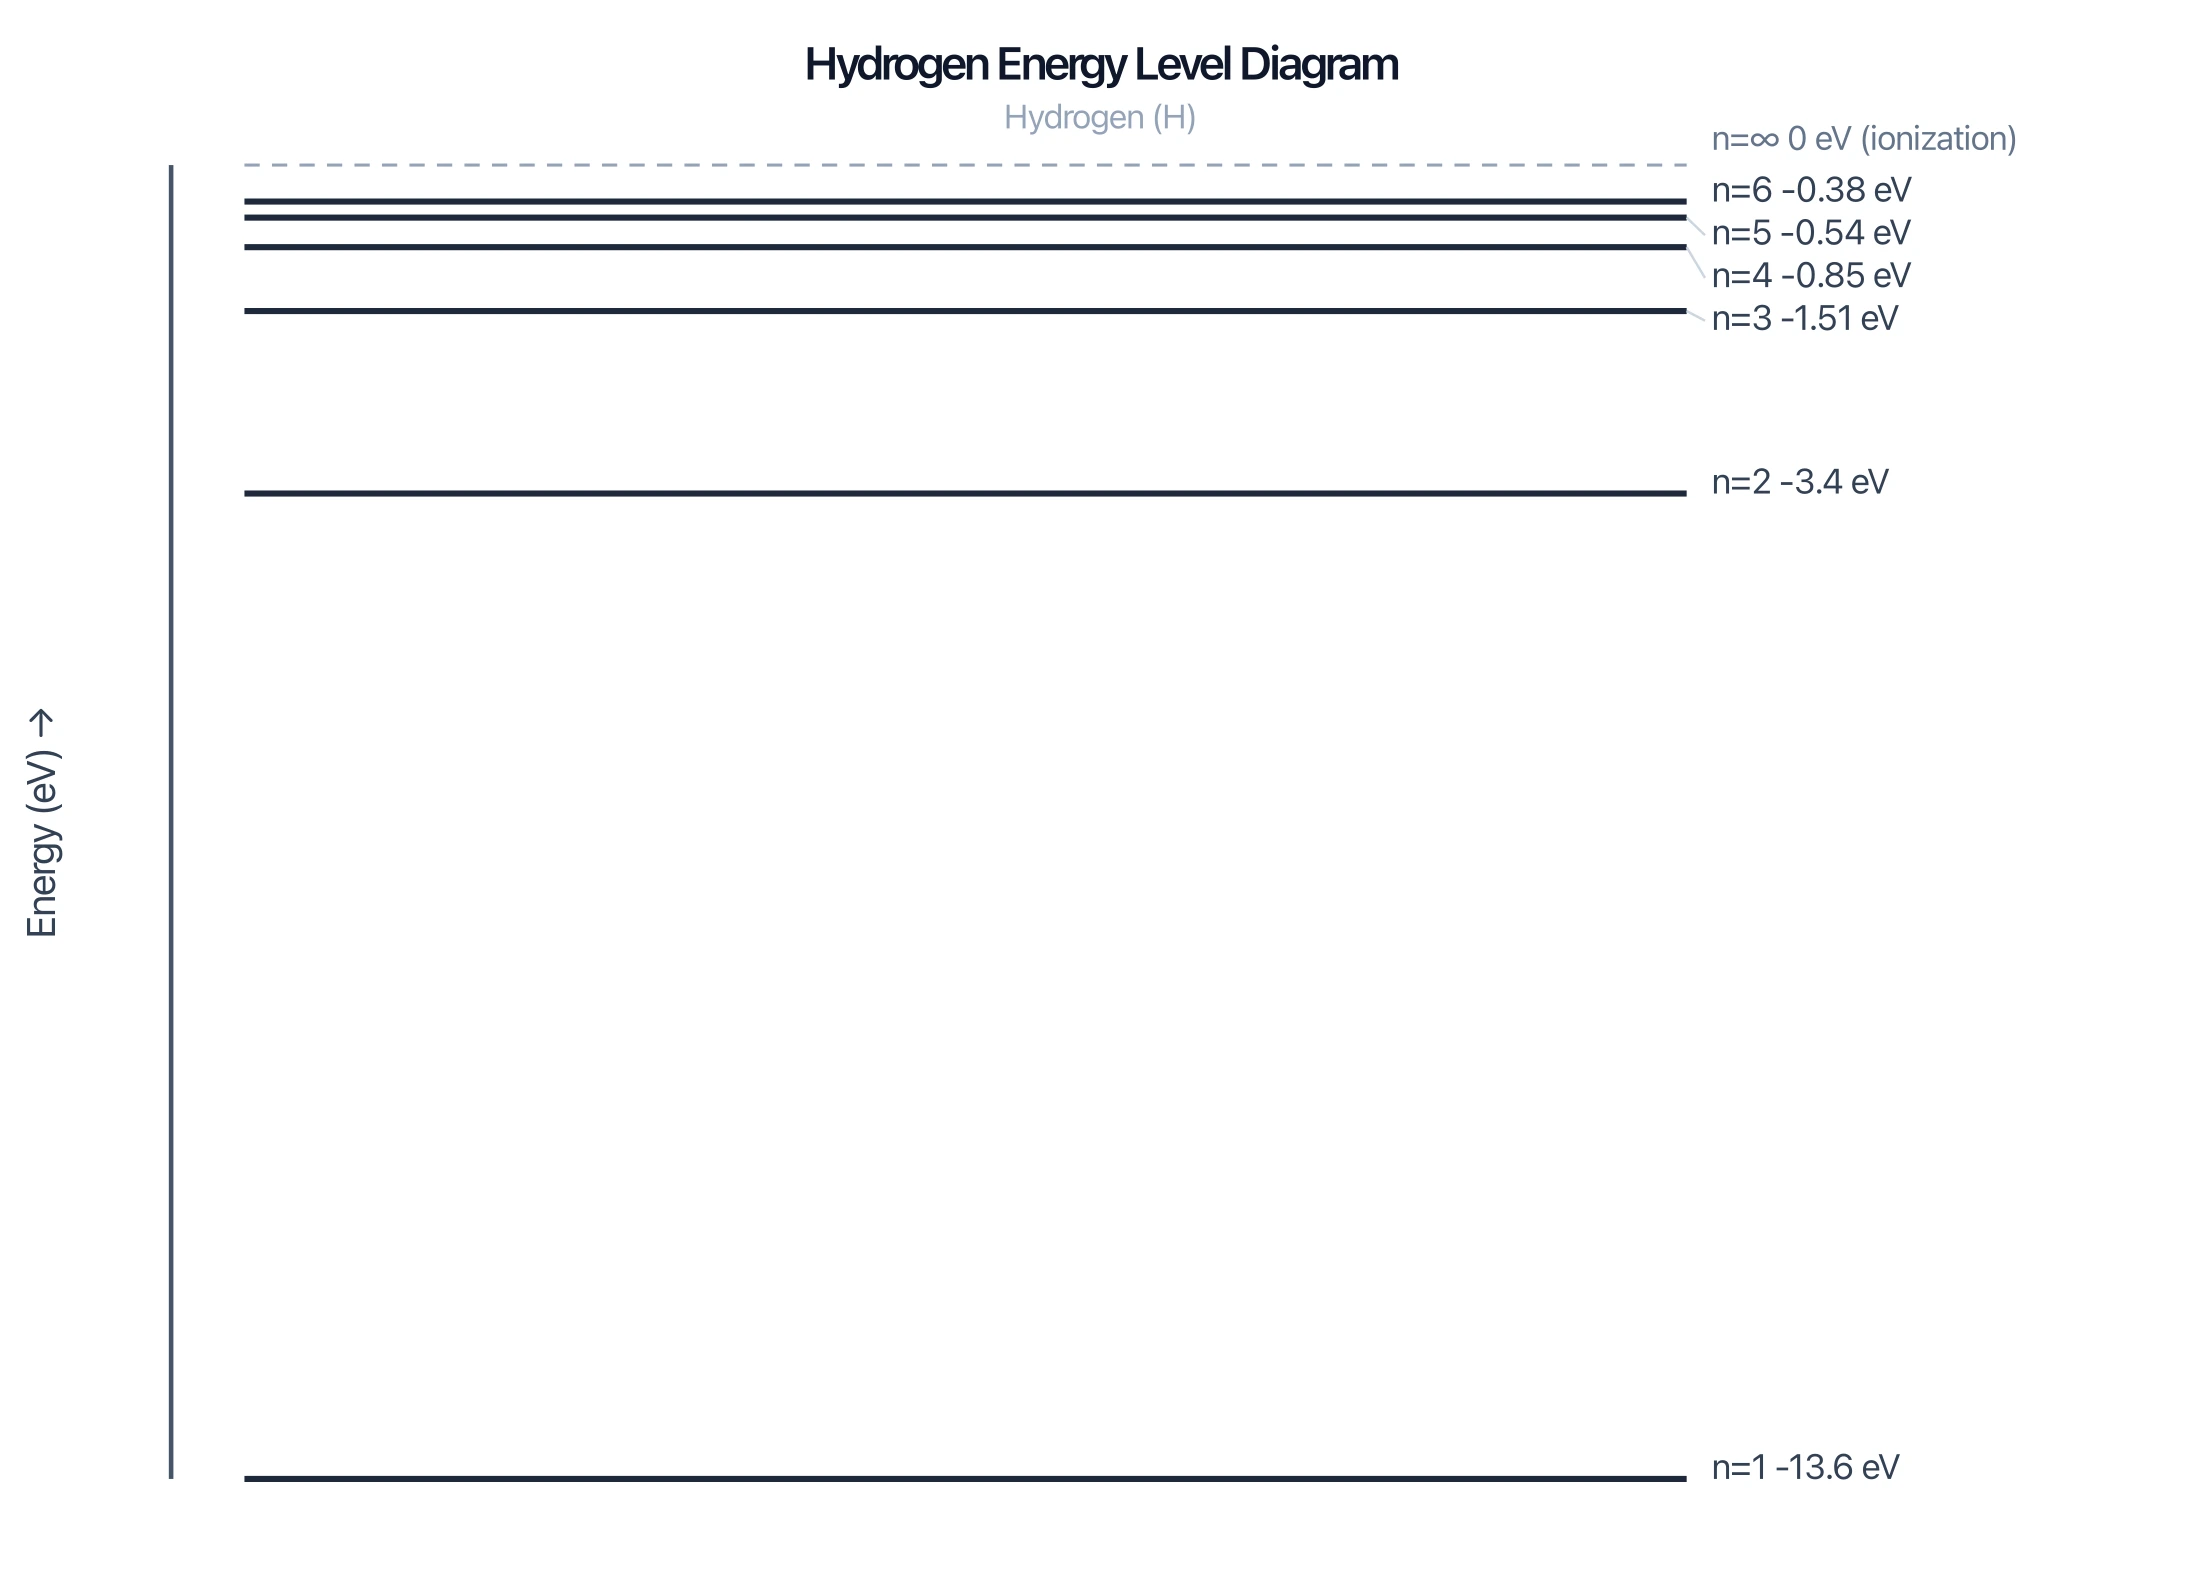
For hydrogen, the levels follow E = −13.6/n² eV, so n=1 is −13.6 eV, n=2 is −3.4 eV, n=3 is −1.51 eV, and so on up to 0 eV at ionization.
Energy Level Diagram Generator
Create atomic energy level diagrams with electron transitions and spectral series for hydrogen and other atoms, and download them free as SVG or PNG.
Make an energy level diagram ->Absorption vs Emission
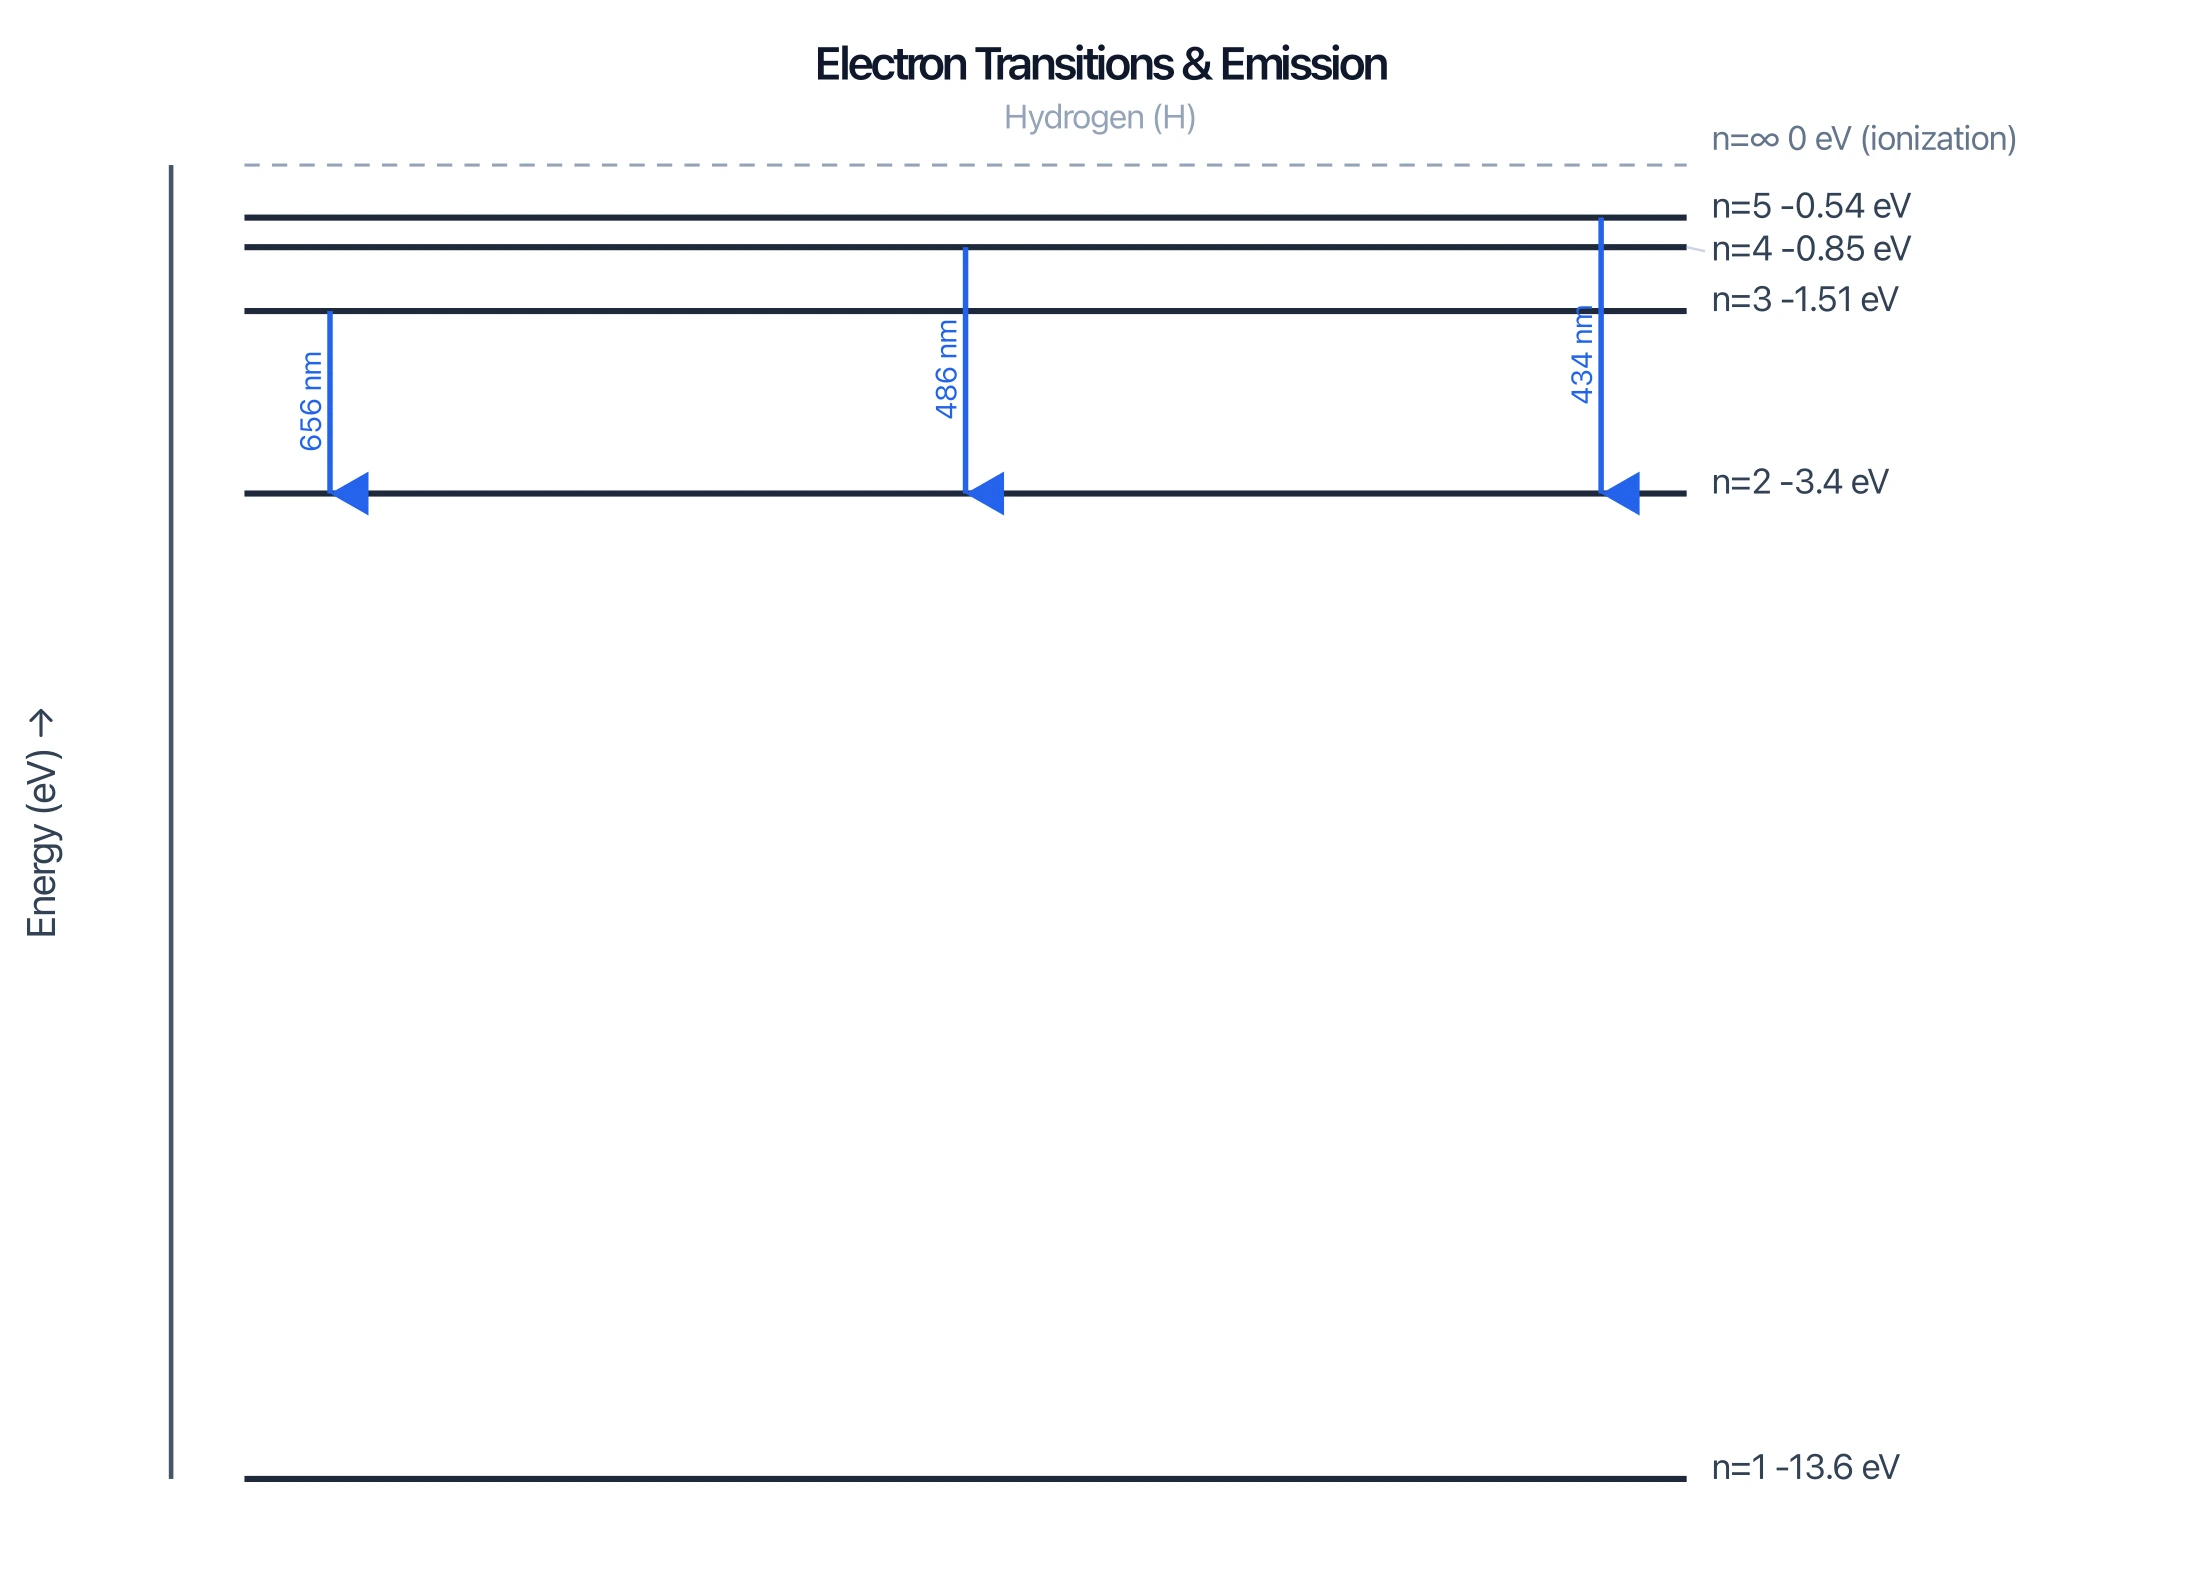
An electron changes levels by exchanging a photon, and the direction tells you which is which:
- Absorption (upward): the electron absorbs a photon and jumps to a higher level. The photon's energy must exactly equal the gap between the two levels.
- Emission (downward): the electron falls to a lower level and releases a photon carrying the energy difference.
In both cases the photon energy equals the difference between the two levels:
ΔE = E_high − E_low = h·f
where h is Planck's constant and f is the photon's frequency. Because the levels are fixed, only specific photon energies — and therefore specific wavelengths — are allowed.
How Spectral Lines Are Produced
Each allowed transition produces light of one exact wavelength, which appears as a spectral line. A downward transition gives an emission line (bright); an upward transition gives an absorption line (dark). Since every element has a unique set of energy levels, it has a unique set of lines — a spectral fingerprint used to identify elements in stars and samples.
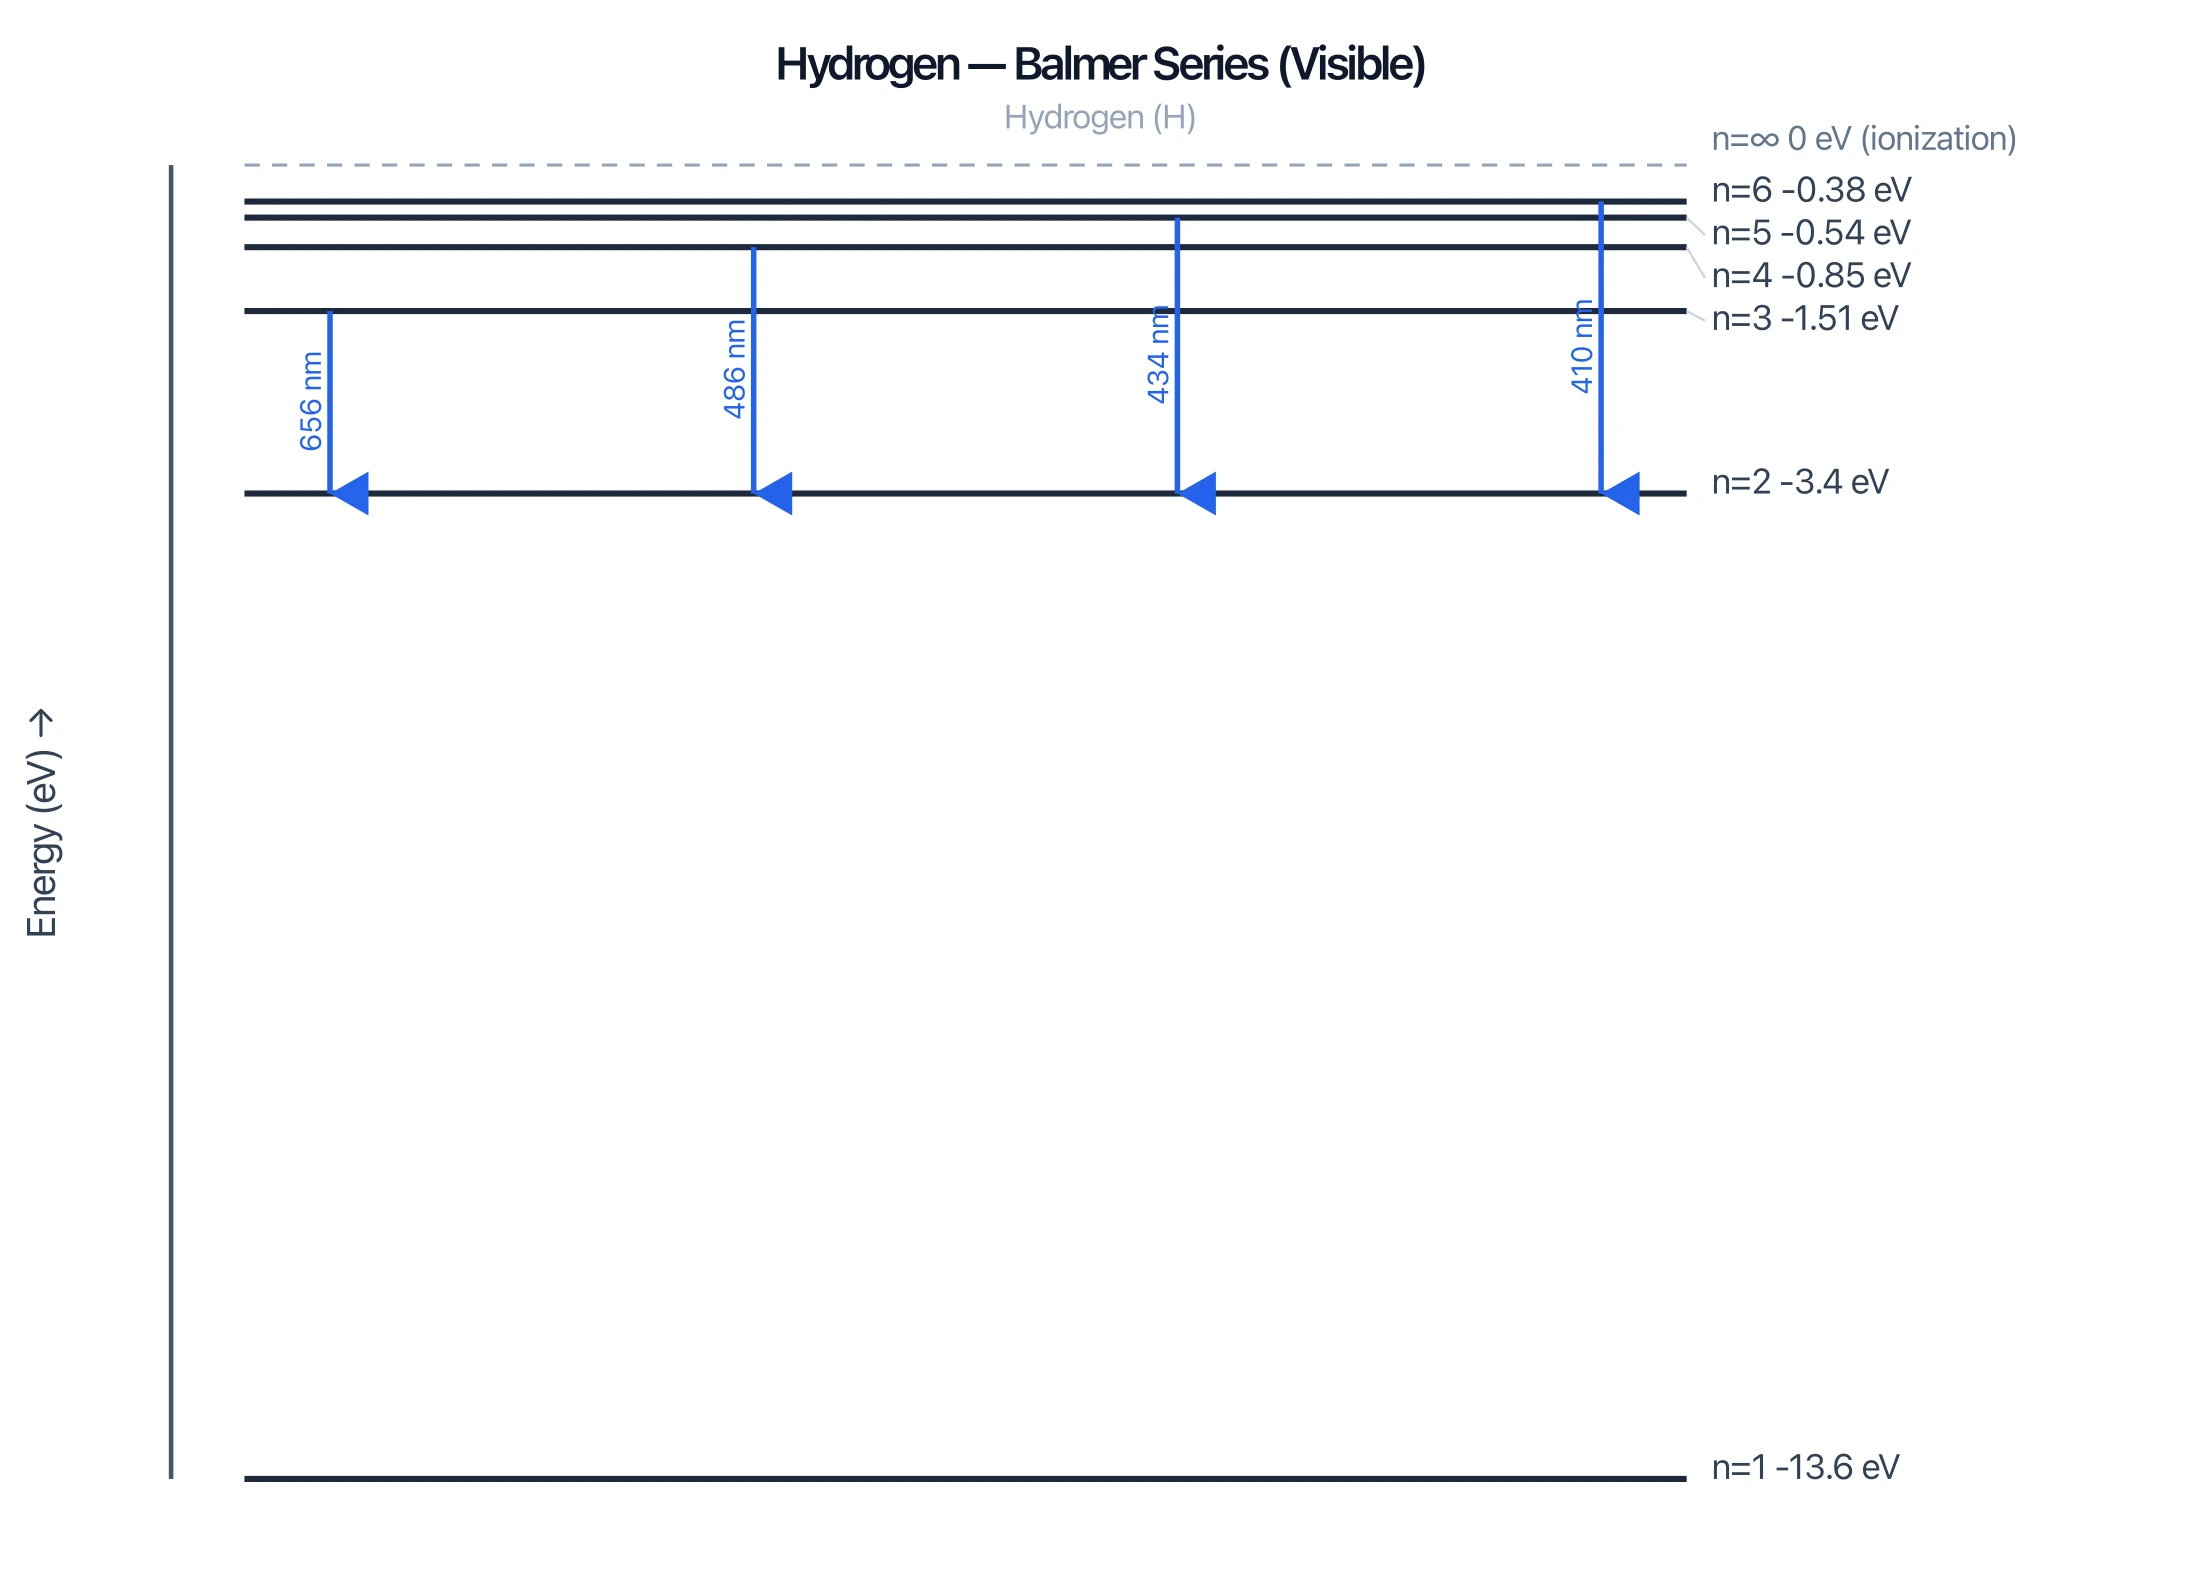
For hydrogen, transitions that end on the same level form a series:
- Lyman series — transitions down to n=1 (ultraviolet).
- Balmer series — transitions down to n=2 (visible light).
- Paschen series — transitions down to n=3 (infrared).
How to Read an Energy Level Diagram
- Identify the levels — the ground state at the bottom, excited states above, ionization at the top.
- Read each arrow's direction — up means absorption, down means emission.
- Find the energy gap — the bigger the gap, the higher the photon energy and the shorter the wavelength.
- Group transitions into series if they share a common end level.
Common Mistakes
- Reversing absorption and emission. Up = absorbing a photon; down = emitting one.
- Treating the levels as evenly spaced. They crowd together near the top (ionization).
- Forgetting the photon energy matches the gap. Only photons with exactly the right energy interact.
- Ignoring which level a series ends on. Lyman ends at n=1, Balmer at n=2, Paschen at n=3.
FAQ
What does an energy level diagram show?
It shows the allowed energy states of an electron in an atom as stacked horizontal lines, and the transitions between them in which photons are absorbed (upward) or emitted (downward).
What is the difference between absorption and emission?
Absorption is when an electron takes in a photon and jumps to a higher energy level. Emission is when an electron drops to a lower level and releases a photon. The photon energy equals the gap between the two levels.
Why are atomic energy levels negative?
Energies are measured relative to a free electron at zero energy. A bound electron has less energy than that, so its levels are negative; the ground state is the most negative, and the levels approach zero at ionization.
How does an energy level diagram explain spectral lines?
Each transition emits or absorbs a photon of one exact energy, which appears as a spectral line. Because every element has unique levels, it produces a unique pattern of lines.
What are the Lyman, Balmer, and Paschen series?
They are groups of hydrogen transitions defined by their end level: Lyman ends at n=1 (ultraviolet), Balmer at n=2 (visible), and Paschen at n=3 (infrared).
Further Reading
Catégories
Plus d'articles

Best Scientific Color Palettes: Hex Codes & Examples
Compare Okabe-Ito, Viridis, Paul Tol and other scientific color palettes for research figures. Includes colorblind-safe hex codes, use cases and code snippets.

Okabe-Ito Palette Hex Codes for Python, R & CSS
Copy all 8 Okabe-Ito palette hex codes with RGB values and ready-to-use Python, R, MATLAB and CSS snippets for colorblind-safe scientific figures.

Science Journal Cover Design: Complete Guide to Getting Your Research Featured
Learn how to design compelling journal cover art that gets your research noticed. Includes technical specs for Nature, Cell, ACS journals, design principles, and step-by-step creation process.