Genera Diagramas de Estados con Potencia de IA
Crea diagramas de máquina de estados UML profesionales al instante. Visualiza estados del sistema, transiciones, condiciones de guardia y comportamientos para diseño y documentación de software.
Generar Diagrama de Estados
By using ConceptViz, you agree not to generate or edit adult, sexual, explicit, unsafe, or policy-violating content. See Content Policy.
Gratis para probar ·
Tu diagrama de estados aparecerá aquí
Describe tus estados y transiciones arriba
Ejemplos de Diagramas de Estados
Explora diagramas de estados generados por IA para varios sistemas
Máquina de Estados de Procesamiento de Pedidos
Máquina de estados del ciclo de vida completo del pedido
Estados de Autenticación de Usuario
Máquina de estados de inicio de sesión y sesión
Sistema de Semáforos
Máquina de estados de señal de tráfico
Estados del Cajero Automático
Diagrama de estados del flujo de trabajo del cajero
Máquina de Estados del Reproductor Multimedia
Estados de interacción del reproductor multimedia
Estados de Conexión TCP
Máquina de estados del protocolo de red
¿Qué Es un Diagrama de Estados?
Un diagrama de estados (también llamado diagrama de máquina de estados o statechart) es un tipo de diagrama de comportamiento en UML (Lenguaje de Modelado Unificado) que muestra los diferentes estados en los que puede existir un objeto o sistema y las transiciones que ocurren entre esos estados. Cada estado representa una condición o situación en el ciclo de vida de un objeto, mientras que las transiciones son activadas por eventos, condiciones o acciones. Los diagramas de estados son herramientas fundamentales en la ingeniería de software para modelar el comportamiento dinámico de sistemas, protocolos y flujos de trabajo.
Notación de Diagrama de Estados UML Explicada
Los diagramas de estados UML usan notación específica: los círculos rellenos representan pseudoestados iniciales (puntos de entrada), los símbolos de ojo de buey marcan los estados finales, los rectángulos redondeados representan estados y las flechas muestran transiciones. Las transiciones se etiquetan con el formato 'evento [guardia] / acción', donde el evento activa la transición, la guardia es una condición opcional entre corchetes y la acción es la operación realizada. Los estados compuestos (estados anidados) muestran máquinas de estados jerárquicas. Los estados de historial permiten que una máquina vuelva a su estado anterior después de una interrupción.
Cuándo Usar Diagramas de Estados
- Modelar el ciclo de vida de objetos en sistemas orientados a objetos
- Documentar protocolos de red y secuencias de comunicación
- Diseñar sistemas embebidos y controladores de hardware
- Describir el comportamiento de la interfaz de usuario y los flujos de pantalla
- Especificar reglas de flujo de trabajo y procesos empresariales
- Documentar la lógica de juegos y los estados de comportamiento de personajes
Cómo Crear un Diagrama de Estados Efectivo
Comienza identificando todos los estados posibles de tu sistema, tanto los estados normales de operación como los estados excepcionales como error o tiempo de espera agotado. Luego identifica los eventos que causan cambios de estado y las condiciones de guardia que deben ser verdaderas para que ocurra la transición. Mapea las acciones realizadas durante las transiciones y dentro de los estados (actividades de entrada, salida y realización). Usa estados compuestos para agrupar estados relacionados y reducir la complejidad. Incluye siempre un estado inicial (círculo relleno) y estados finales donde corresponda. Revisa el diagrama para asegurar que todos los estados sean alcanzables y que todas las transiciones sean válidas.
Diagramas de Estados vs. Diagramas de Flujo
Si bien tanto los diagramas de estados como los diagramas de flujo modelan procesos, sirven para diferentes propósitos. Los diagramas de flujo muestran la secuencia de operaciones o decisiones en un proceso, enfocándose en el flujo de control de principio a fin. Los diagramas de estados se enfocan en lo que un objeto o sistema ES en un momento dado, su estado actual, y cómo los eventos hacen que cambie. Los diagramas de estados son más apropiados para sistemas reactivos que responden a eventos externos, mientras que los diagramas de flujo se adaptan a flujos de trabajo procedimentales. Cuando el comportamiento del sistema depende en gran medida del historial (en qué estado estaba el objeto antes), los diagramas de estados son la herramienta adecuada.
Preguntas frecuentes
Herramientas de Diagrama Relacionadas
 Diagramas
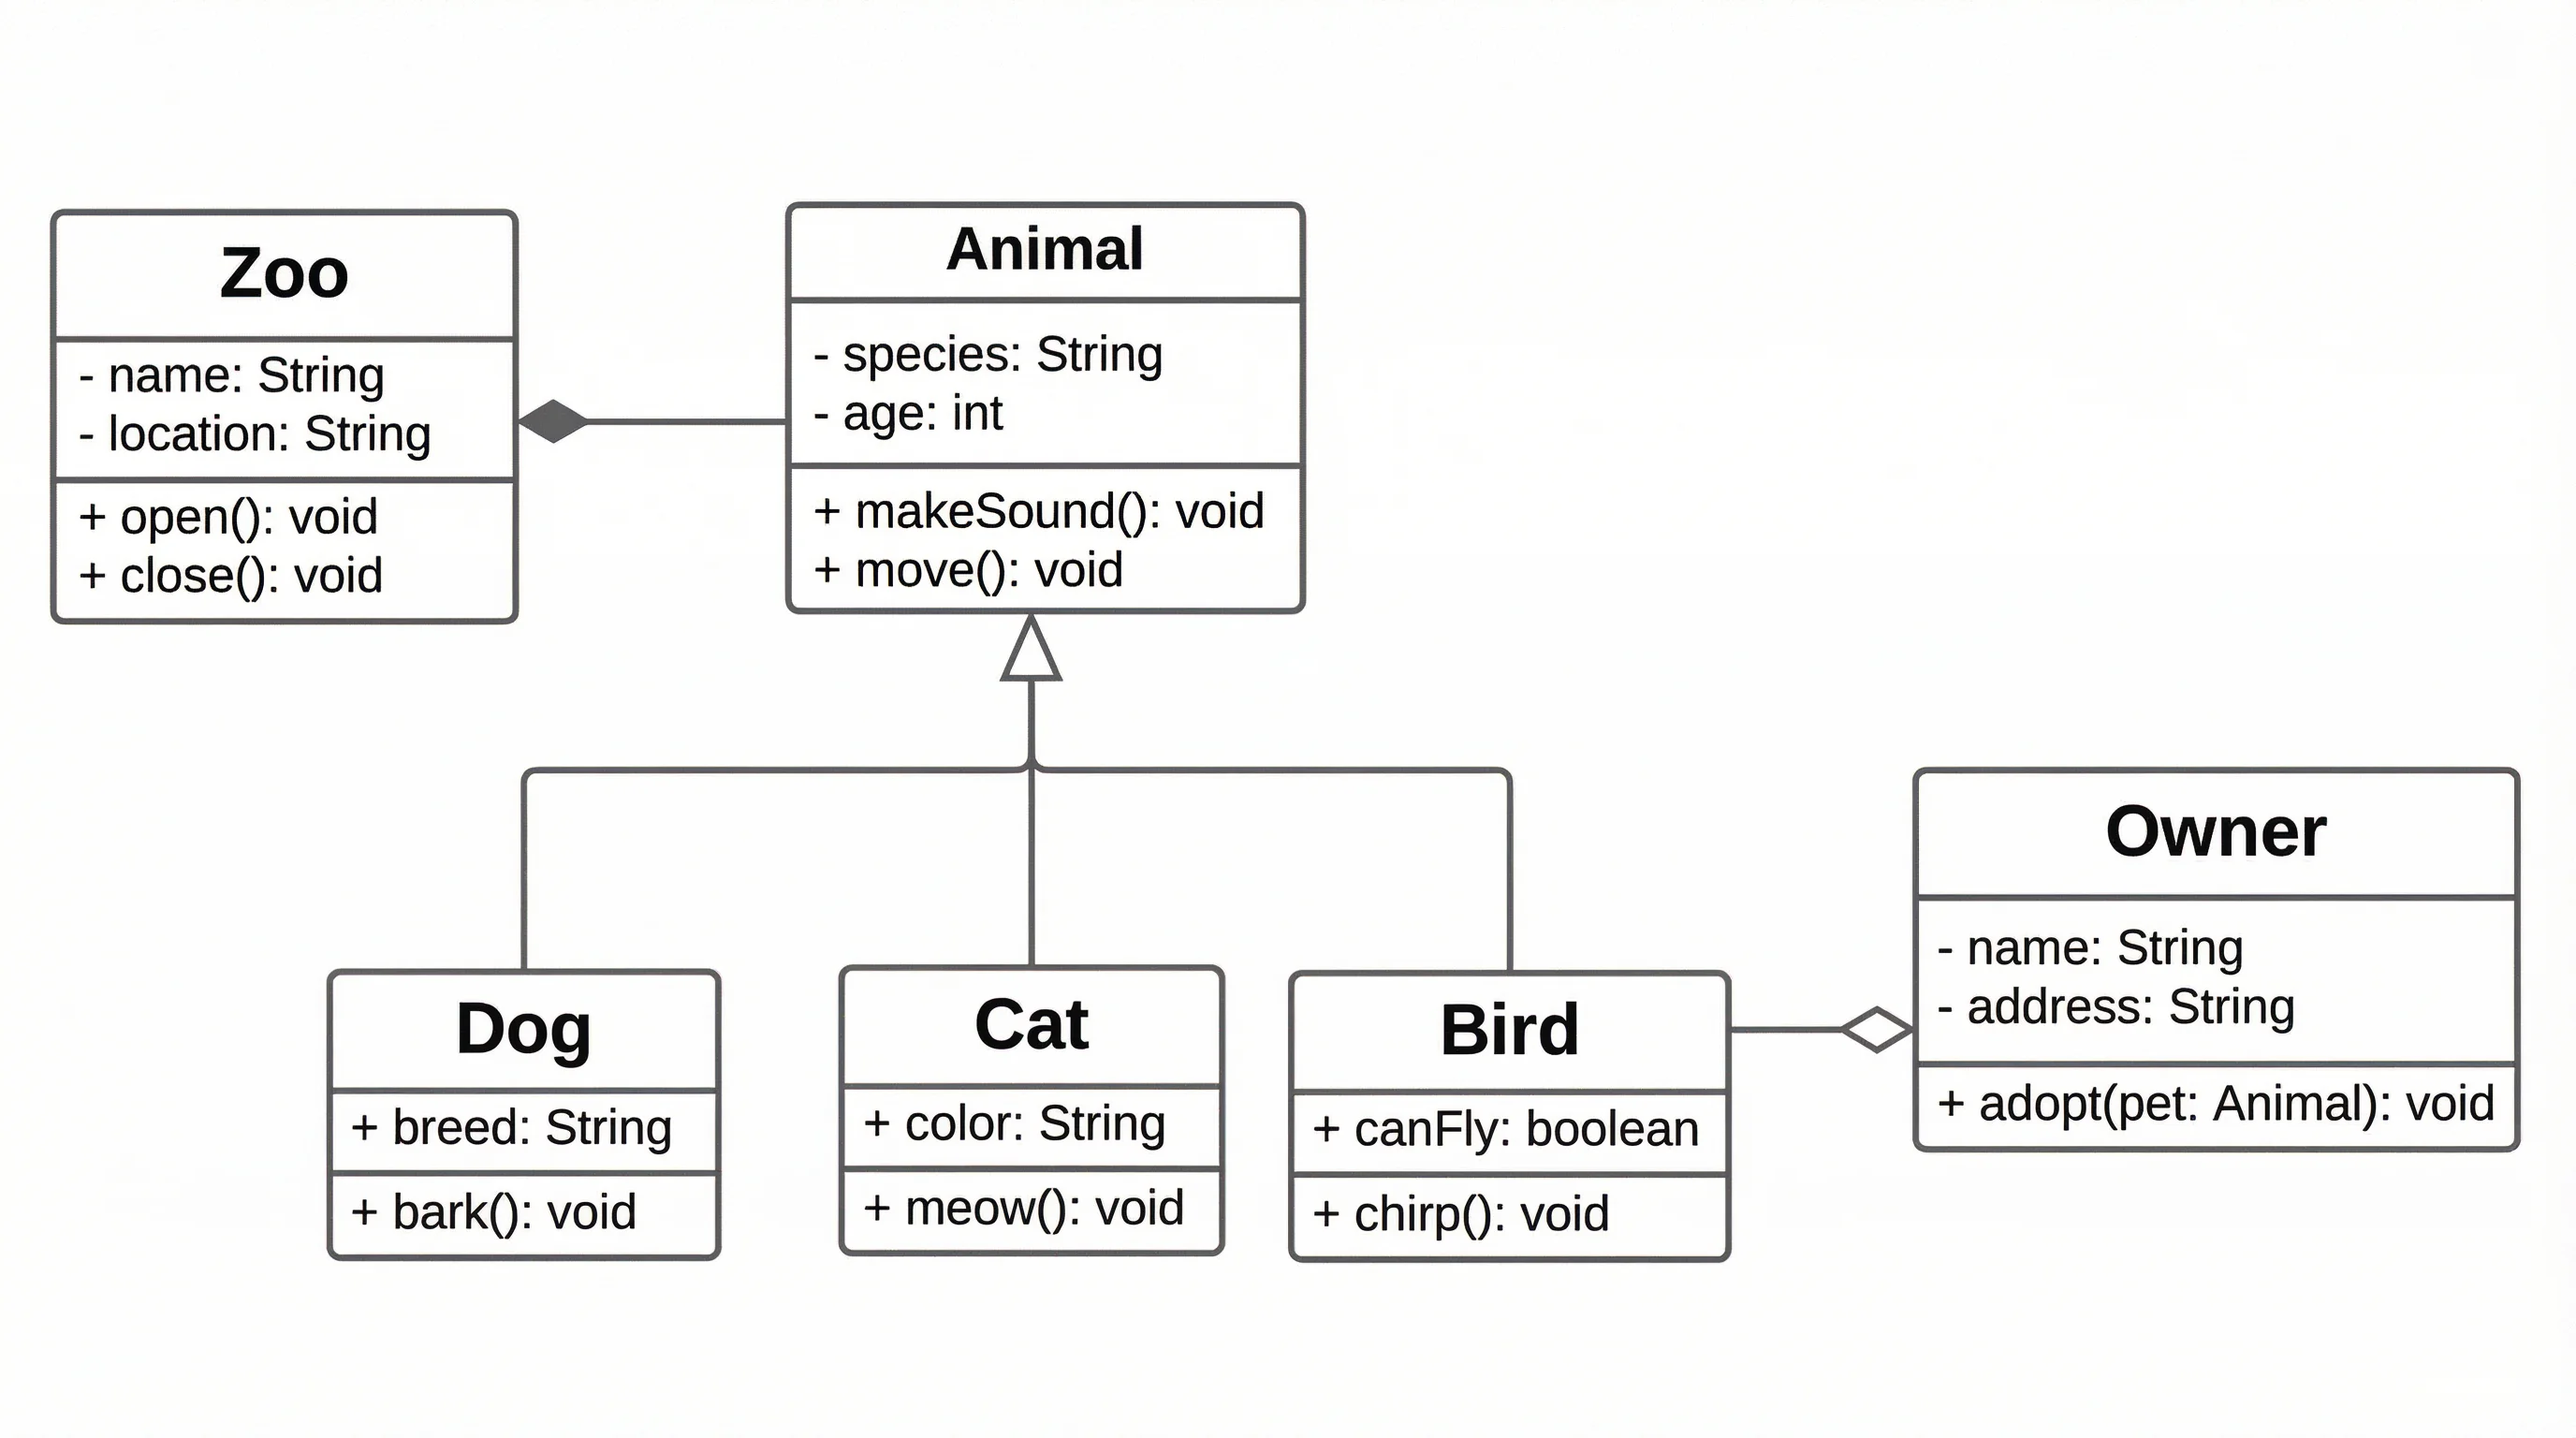
Generador de Diagramas UML
Crea diagramas UML completos incluyendo diagramas de clases, secuencia y casos de uso
 Diagramas
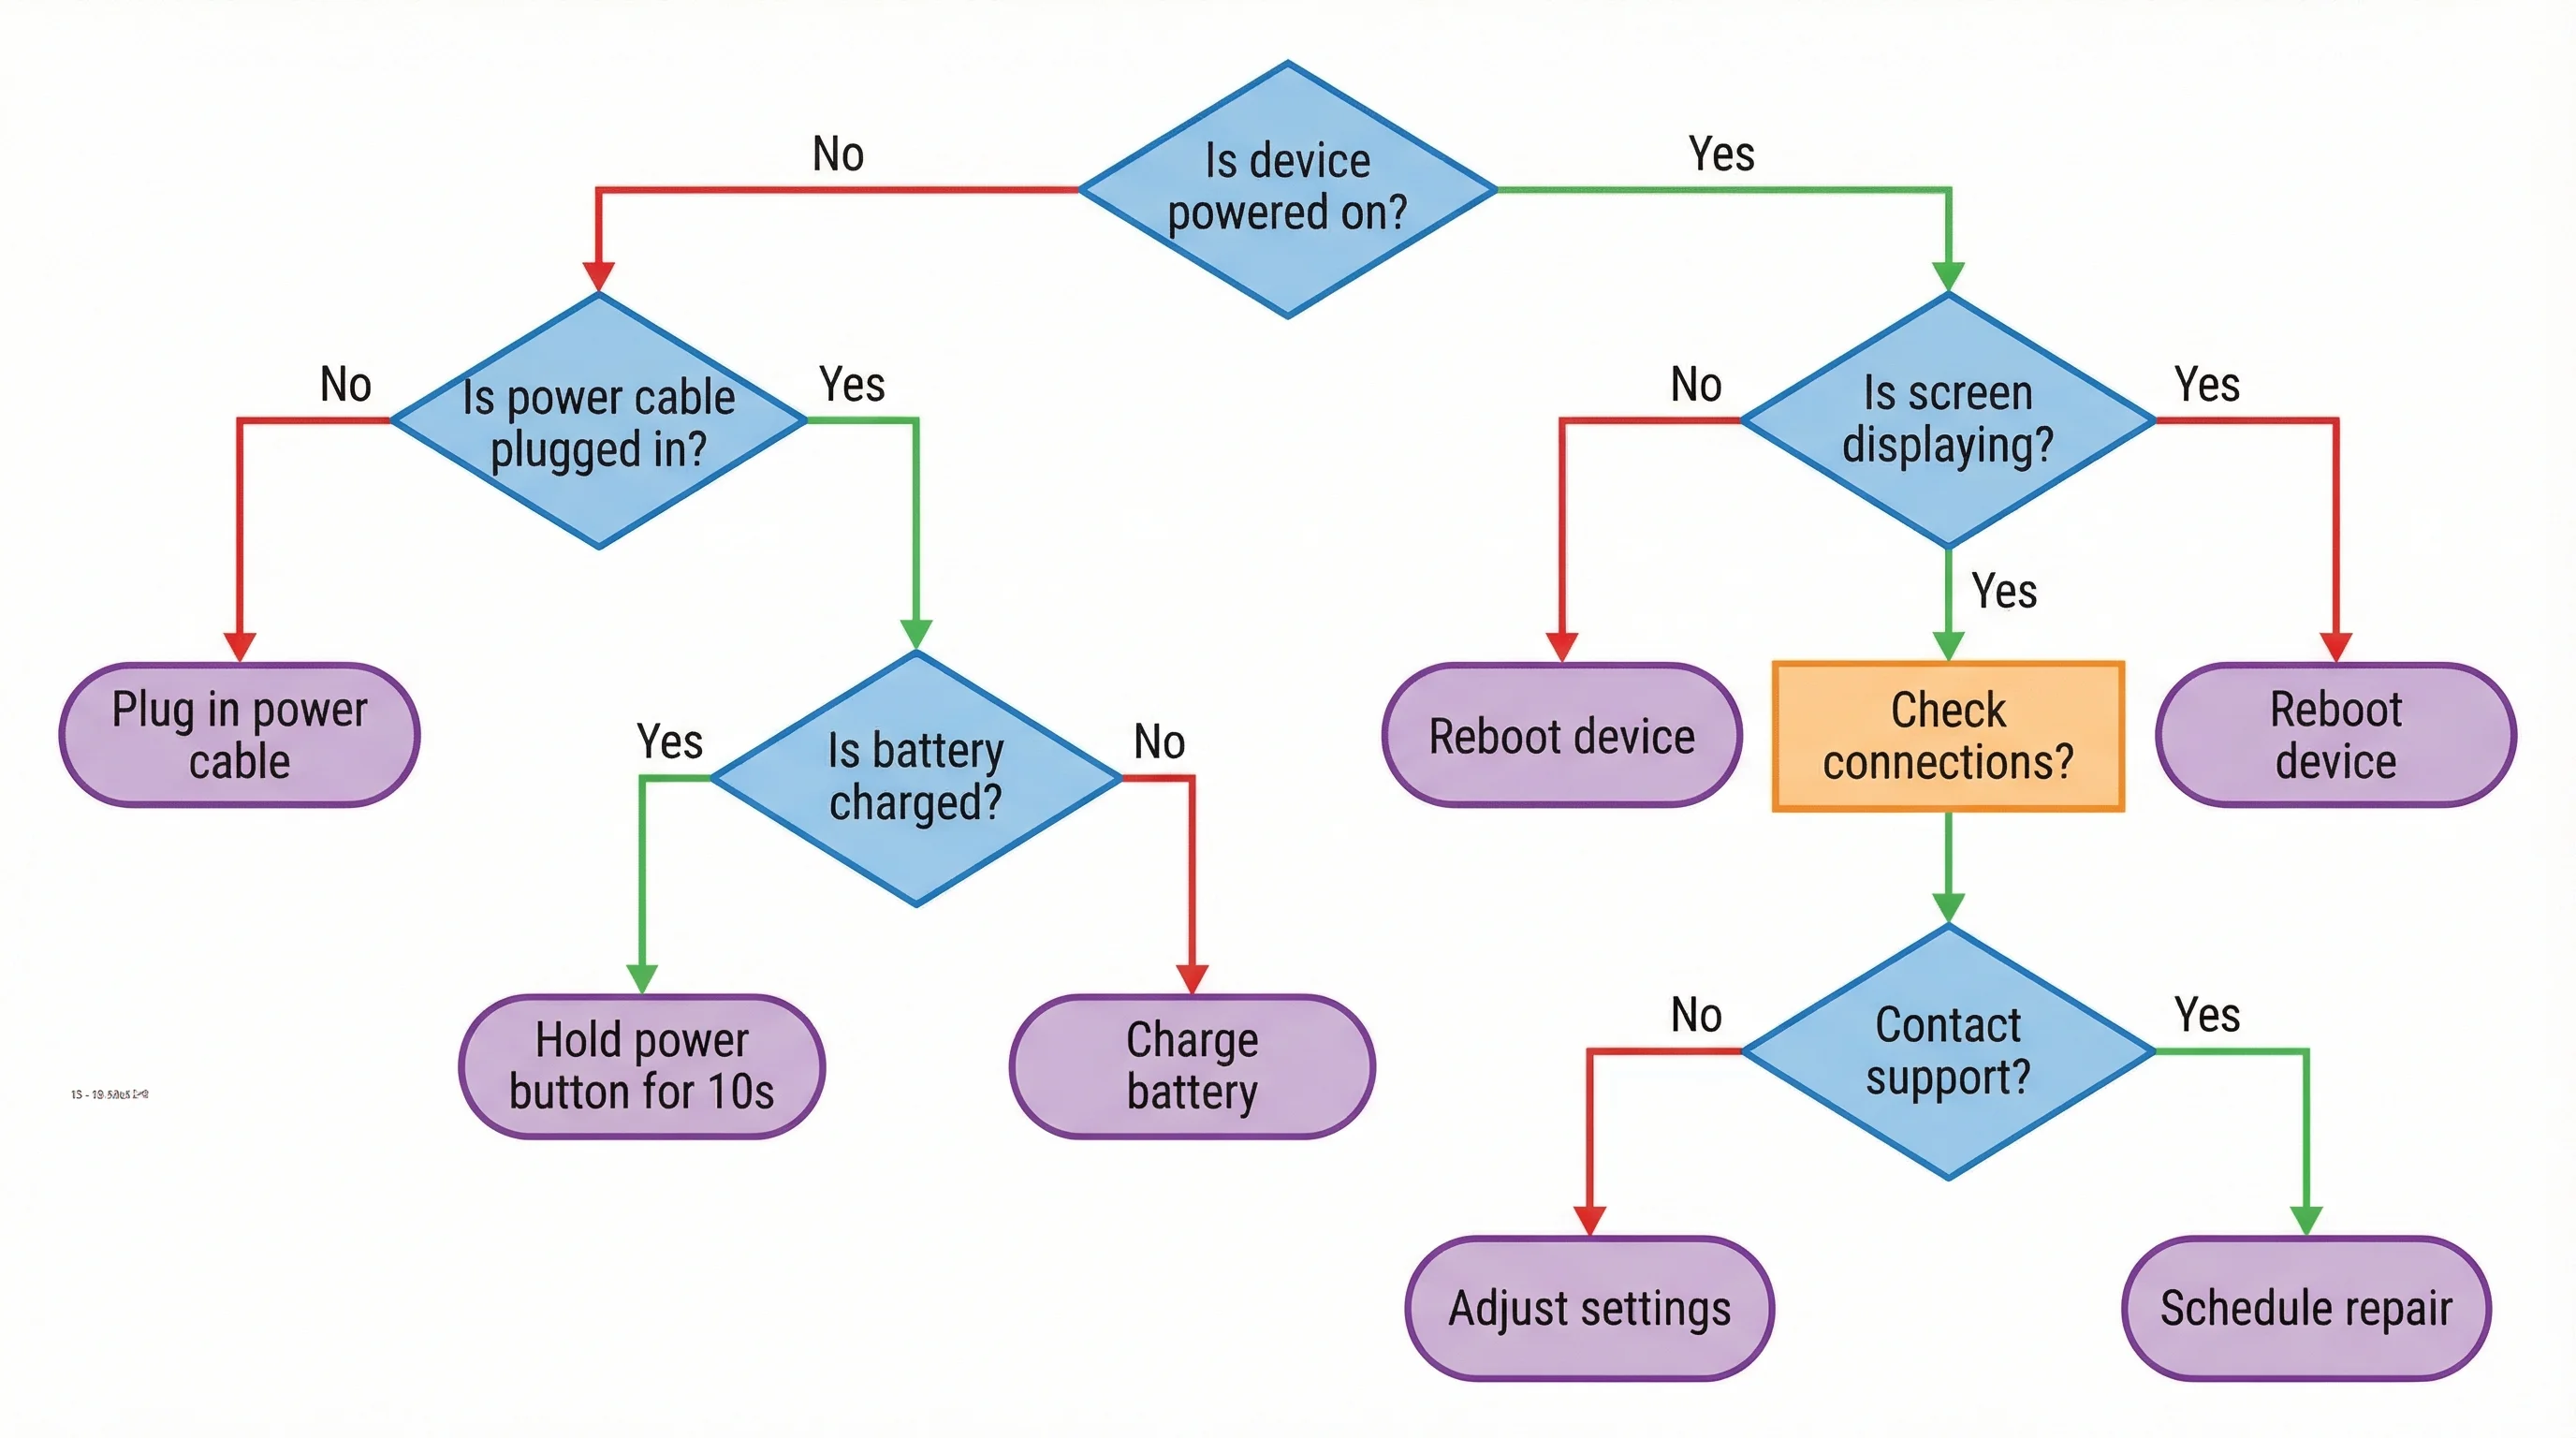
Generador de Diagramas de Flujo con IA
Genera diagramas de flujo y diagramas de procesos profesionales con IA
 Diagramas
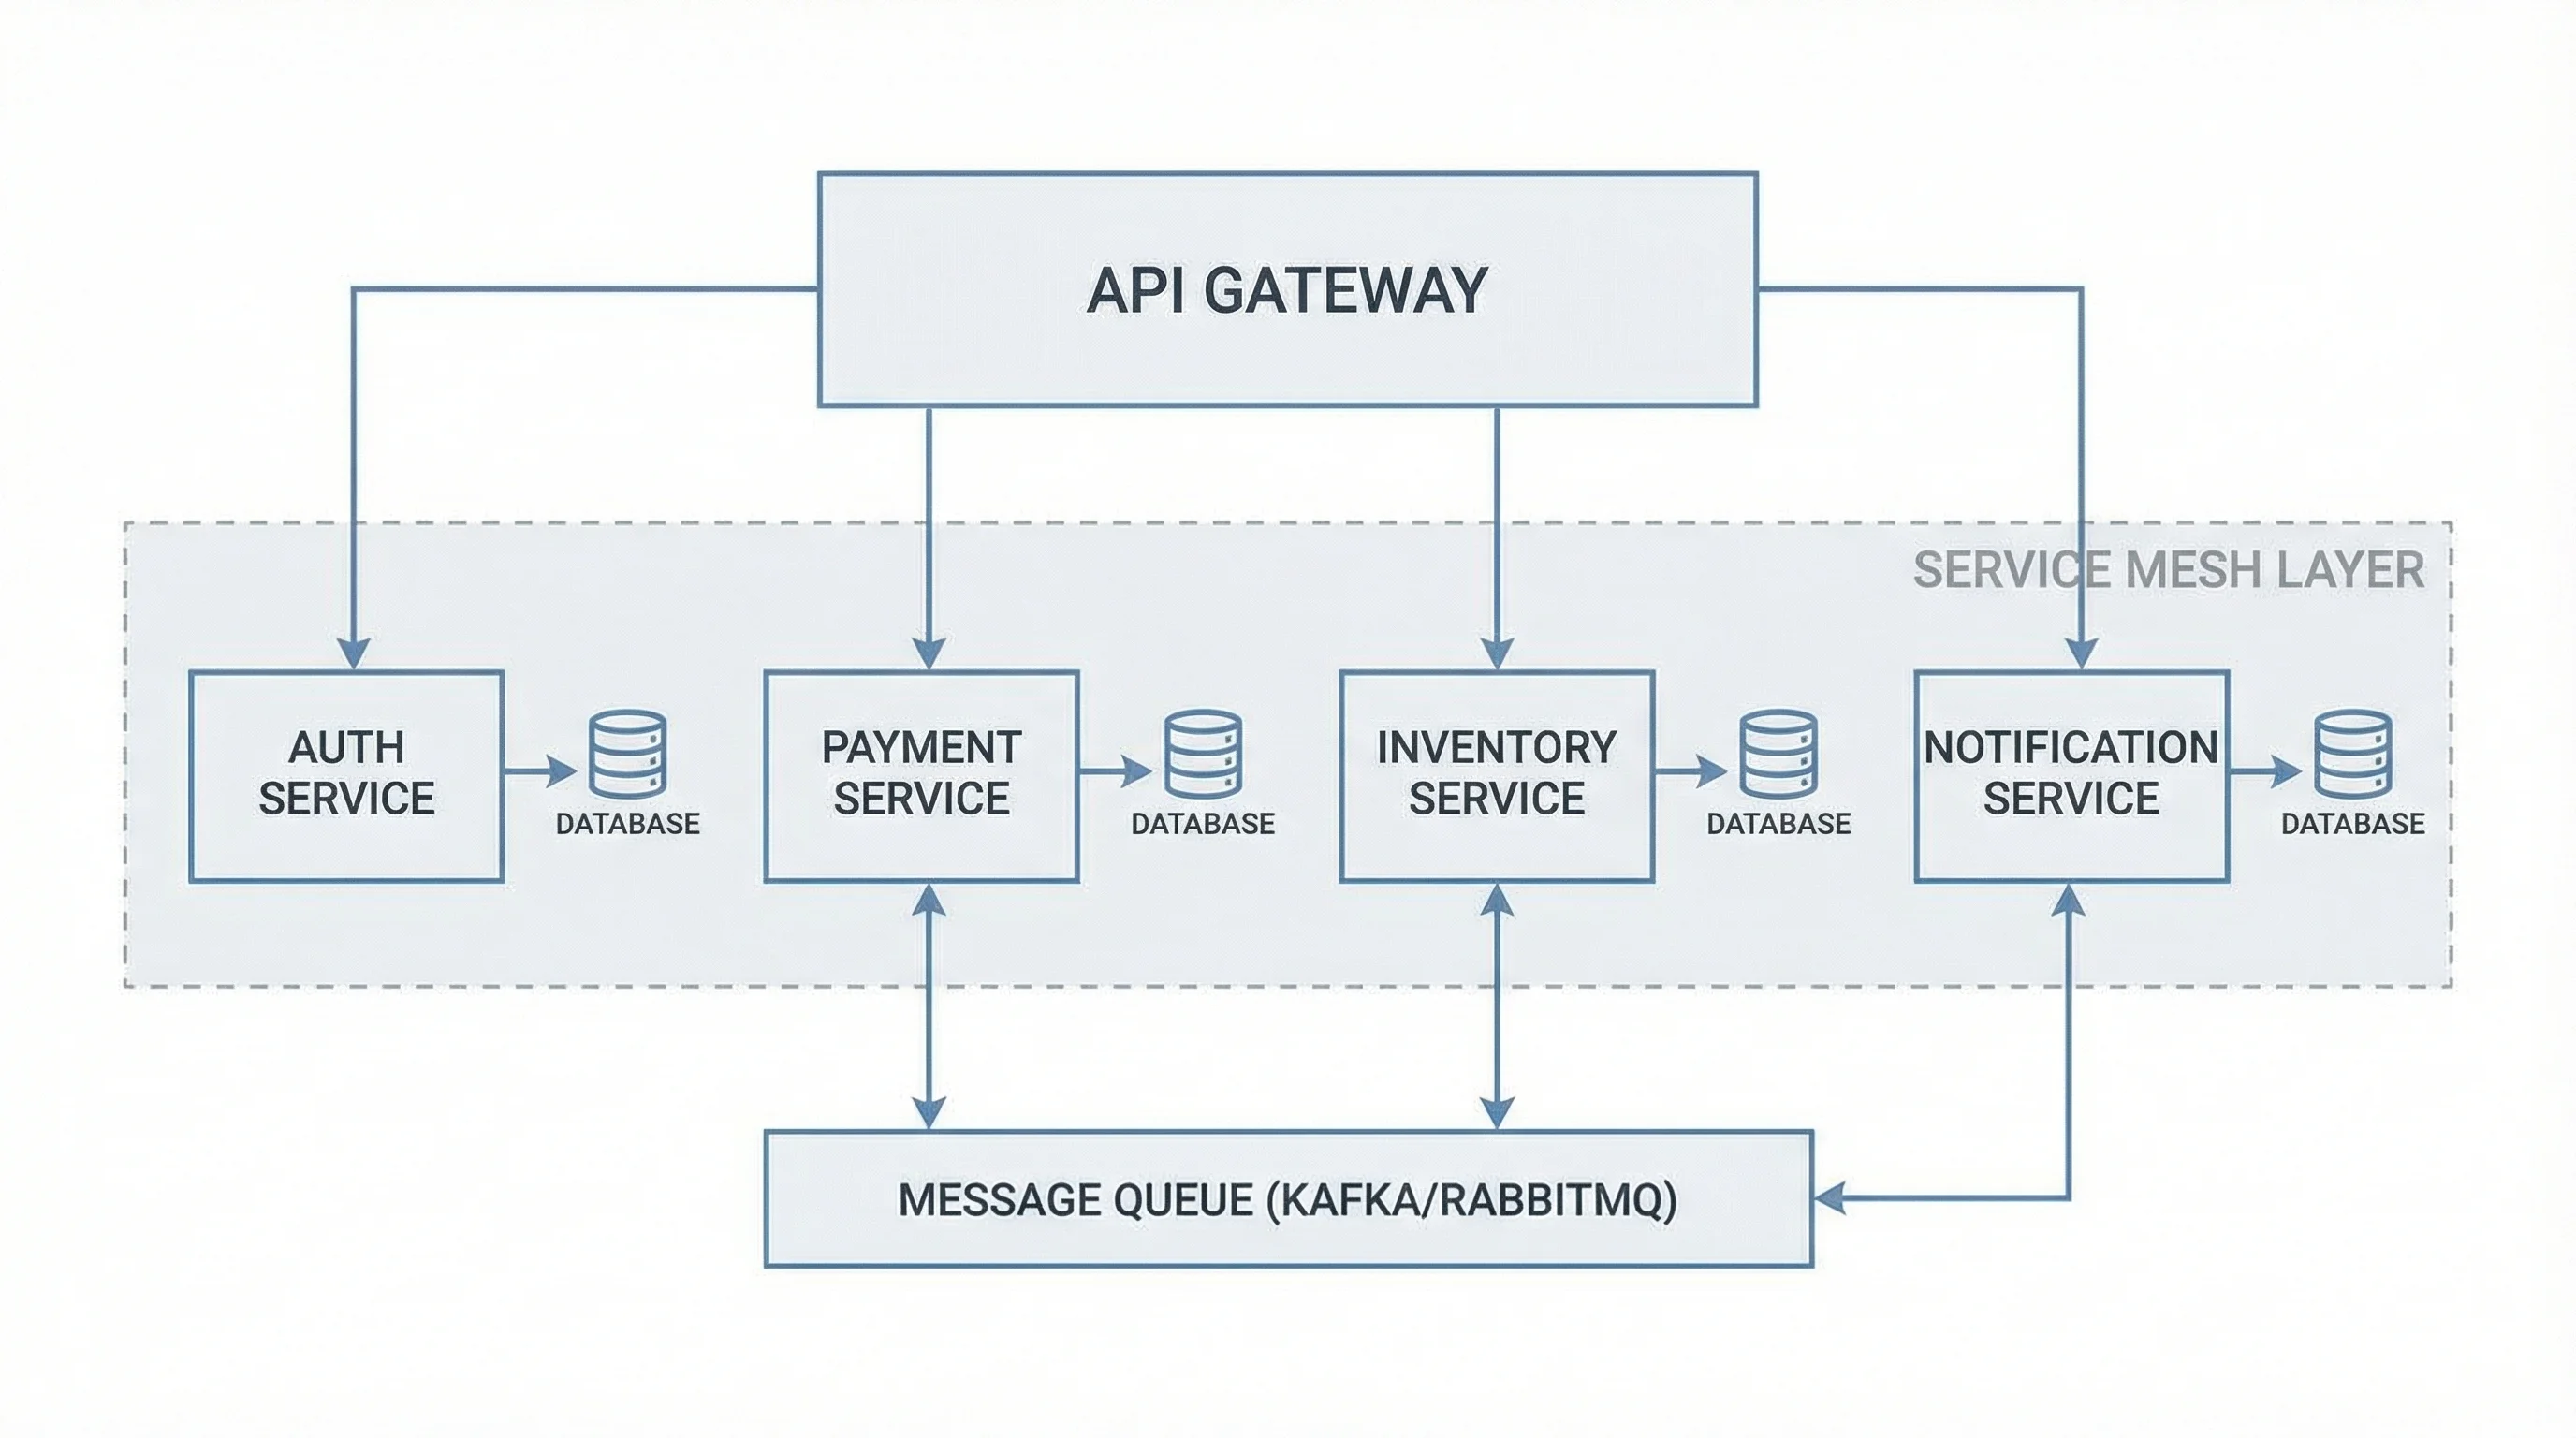
Generador de Diagramas de Arquitectura de Software
Visualiza la arquitectura del sistema con diagramas profesionales de componentes y despliegue