")
How to Make a Punnett Square: Step-by-Step Genetics Guide (2026)
Learn how to make a Punnett square for monohybrid and dihybrid crosses. Covers genotype, phenotype ratios, incomplete dominance, and common mistakes with worked examples.
A Punnett square is one of the simplest tools in genetics for predicting the probability of offspring inheriting specific traits. Named after Reginald Punnett, who popularized the method in the early 1900s, it remains a fundamental teaching tool in biology classes from middle school through university genetics courses. The University of Utah's Teach Genetics site offers excellent practice problems for students learning the technique.
The basic idea is straightforward: you create a grid that crosses the alleles from two parents to show all possible genetic combinations in their offspring. This lets you calculate genotype and phenotype ratios without memorizing complex probability rules.
This guide explains how to make a Punnett square from scratch, covers both monohybrid and dihybrid crosses, and walks through common mistakes and edge cases like incomplete dominance and codominance.
Pedigree Chart Maker
Generate genetics pedigree charts showing inheritance patterns across multiple generations from a text description.
Create pedigree charts free →What a Punnett Square Shows
A Punnett square is a grid that predicts the genotype ratios of offspring from a specific cross between two parents.
It shows:
- all possible allele combinations
- the probability of each genotype
- the expected phenotype ratio (when you know the dominance pattern)
It does not show:
- what will definitely happen (it shows probabilities, not certainties)
- traits controlled by many genes (polygenic traits)
- environmental effects on phenotype
- linked genes or crossing over
For single-gene traits with clear dominance, a Punnett square is the fastest way to predict inheritance outcomes. Biology LibreTexts provides a thorough introduction to Punnett Squares with worked examples.
Key Genetics Terms
Before building a Punnett square, you need to understand these terms:
| Term | Definition | Example |
|---|---|---|
| Gene | A unit of heredity on a chromosome | Gene for flower color |
| Allele | A variant of a gene | Purple (B) vs white (b) |
| Dominant | The allele that shows in heterozygotes | B (purple) |
| Recessive | The allele hidden in heterozygotes | b (white) |
| Homozygous | Two identical alleles | BB or bb |
| Heterozygous | Two different alleles | Bb |
| Genotype | The genetic makeup | BB, Bb, or bb |
| Phenotype | The observable trait | Purple or white flowers |
How to Make a Punnett Square: Monohybrid Cross
A monohybrid cross involves one gene with two alleles.
Example: Flower color (B = purple, b = white)
Cross: Heterozygous purple (Bb) × Heterozygous purple (Bb)
Step 1: Identify the parent genotypes
- Parent 1: Bb
- Parent 2: Bb
Step 2: Write the alleles along the grid edges
Place one parent's alleles across the top and the other parent's alleles down the left side:
| B | b | |
|---|---|---|
| B | ||
| b |
Step 3: Fill in each cell
Combine the column allele with the row allele for each cell:
| B | b | |
|---|---|---|
| B | BB | Bb |
| b | Bb | bb |
Step 4: Read the results
Genotype ratio: 1 BB : 2 Bb : 1 bb
Phenotype ratio: 3 purple : 1 white (because BB and Bb both show the dominant purple phenotype)
Probability of white flowers: 1/4 or 25%
That is the entire process. Every Punnett square follows this same logic.
More Monohybrid Examples
Homozygous dominant × Heterozygous
Cross: BB × Bb
| B | b | |
|---|---|---|
| B | BB | Bb |
| B | BB | Bb |
Result: All offspring are purple (50% BB, 50% Bb). No white flowers possible.
Heterozygous × Homozygous recessive (test cross)
Cross: Bb × bb
| b | b | |
|---|---|---|
| B | Bb | Bb |
| b | bb | bb |
Result: 50% purple (Bb), 50% white (bb). This is a test cross — used to determine whether an organism showing the dominant phenotype is homozygous (BB) or heterozygous (Bb).
How to Make a Dihybrid Punnett Square
A dihybrid cross involves two genes simultaneously. This produces a 4×4 grid with 16 possible combinations.
Example: Seed shape (R = round, r = wrinkled) and seed color (Y = yellow, y = green)
Cross: RrYy × RrYy
Step 1: Determine the gametes
Each parent can produce four types of gametes by combining one allele from each gene:
- Parent (RrYy) gametes: RY, Ry, rY, ry
Step 2: Set up the 4×4 grid
| RY | Ry | rY | ry | |
|---|---|---|---|---|
| RY | RRYY | RRYy | RrYY | RrYy |
| Ry | RRYy | RRyy | RrYy | Rryy |
| rY | RrYY | RrYy | rrYY | rrYy |
| ry | RrYy | Rryy | rrYy | rryy |
Step 3: Count the phenotypes
- Round yellow (at least one R and one Y): 9/16
- Round green (at least one R, homozygous yy): 3/16
- Wrinkled yellow (homozygous rr, at least one Y): 3/16
- Wrinkled green (rryy): 1/16
This classic 9:3:3:1 ratio is the expected outcome for a dihybrid cross between two double heterozygotes — one of the foundational results of Mendelian genetics.
Beyond Simple Dominance
Not all traits follow the simple dominant/recessive pattern. Here are two important exceptions:
Incomplete dominance
The heterozygote shows a blended phenotype.
Example: Red flower (RR) × White flower (WW)
| R | R | |
|---|---|---|
| W | RW | RW |
| W | RW | RW |
All F1 offspring are RW = pink. The phenotype ratio in an F2 cross (RW × RW) would be 1 red : 2 pink : 1 white.
Codominance
Both alleles are fully expressed in the heterozygote.
Example: Blood type with alleles Iᴬ and Iᴮ
A person with genotype IᴬIᴮ has type AB blood — both A and B antigens are present. Neither allele is dominant over the other.
Common Punnett Square Mistakes
Mistake 1: Mixing up alleles from the same parent
Each side of the grid represents one parent. Do not accidentally put both parents' alleles on the same axis.
Mistake 2: Forgetting that uppercase = dominant
By convention, dominant alleles are uppercase (B) and recessive alleles are lowercase (b). Mixing these up changes the entire result.
Mistake 3: Counting genotypes instead of phenotypes
The genotype ratio and phenotype ratio are different. BB and Bb have different genotypes but the same phenotype if B is fully dominant.
Mistake 4: Wrong gametes for dihybrid crosses
For a dihybrid cross, each gamete must contain one allele from each gene. A parent with genotype RrYy produces gametes RY, Ry, rY, ry — not RR, rr, YY, or yy.
Mistake 5: Assuming Punnett squares always give exact results
A Punnett square shows probabilities, not guarantees. Having a 3:1 ratio does not mean exactly 3 out of every 4 offspring will show the dominant trait — especially in small sample sizes.
Mistake 6: Using Punnett squares for polygenic traits
Traits like height, skin color, and intelligence are controlled by many genes. A simple Punnett square cannot model these.
AI Scientific Image Generator
Generate clear biology diagrams, genetics visuals, and educational science illustrations.
Punnett Squares in Real Applications
Genetic counseling
Punnett squares help genetic counselors explain inheritance risks to families. If both parents are carriers (heterozygous) for a recessive disorder, the square shows a 25% chance of an affected child.
Plant and animal breeding
Breeders use Punnett squares to predict offspring traits and plan crosses that maximize desired characteristics.
Classroom genetics problems
Most biology courses use Punnett squares as the primary tool for teaching Mendelian inheritance. They make abstract probability concrete and visual.
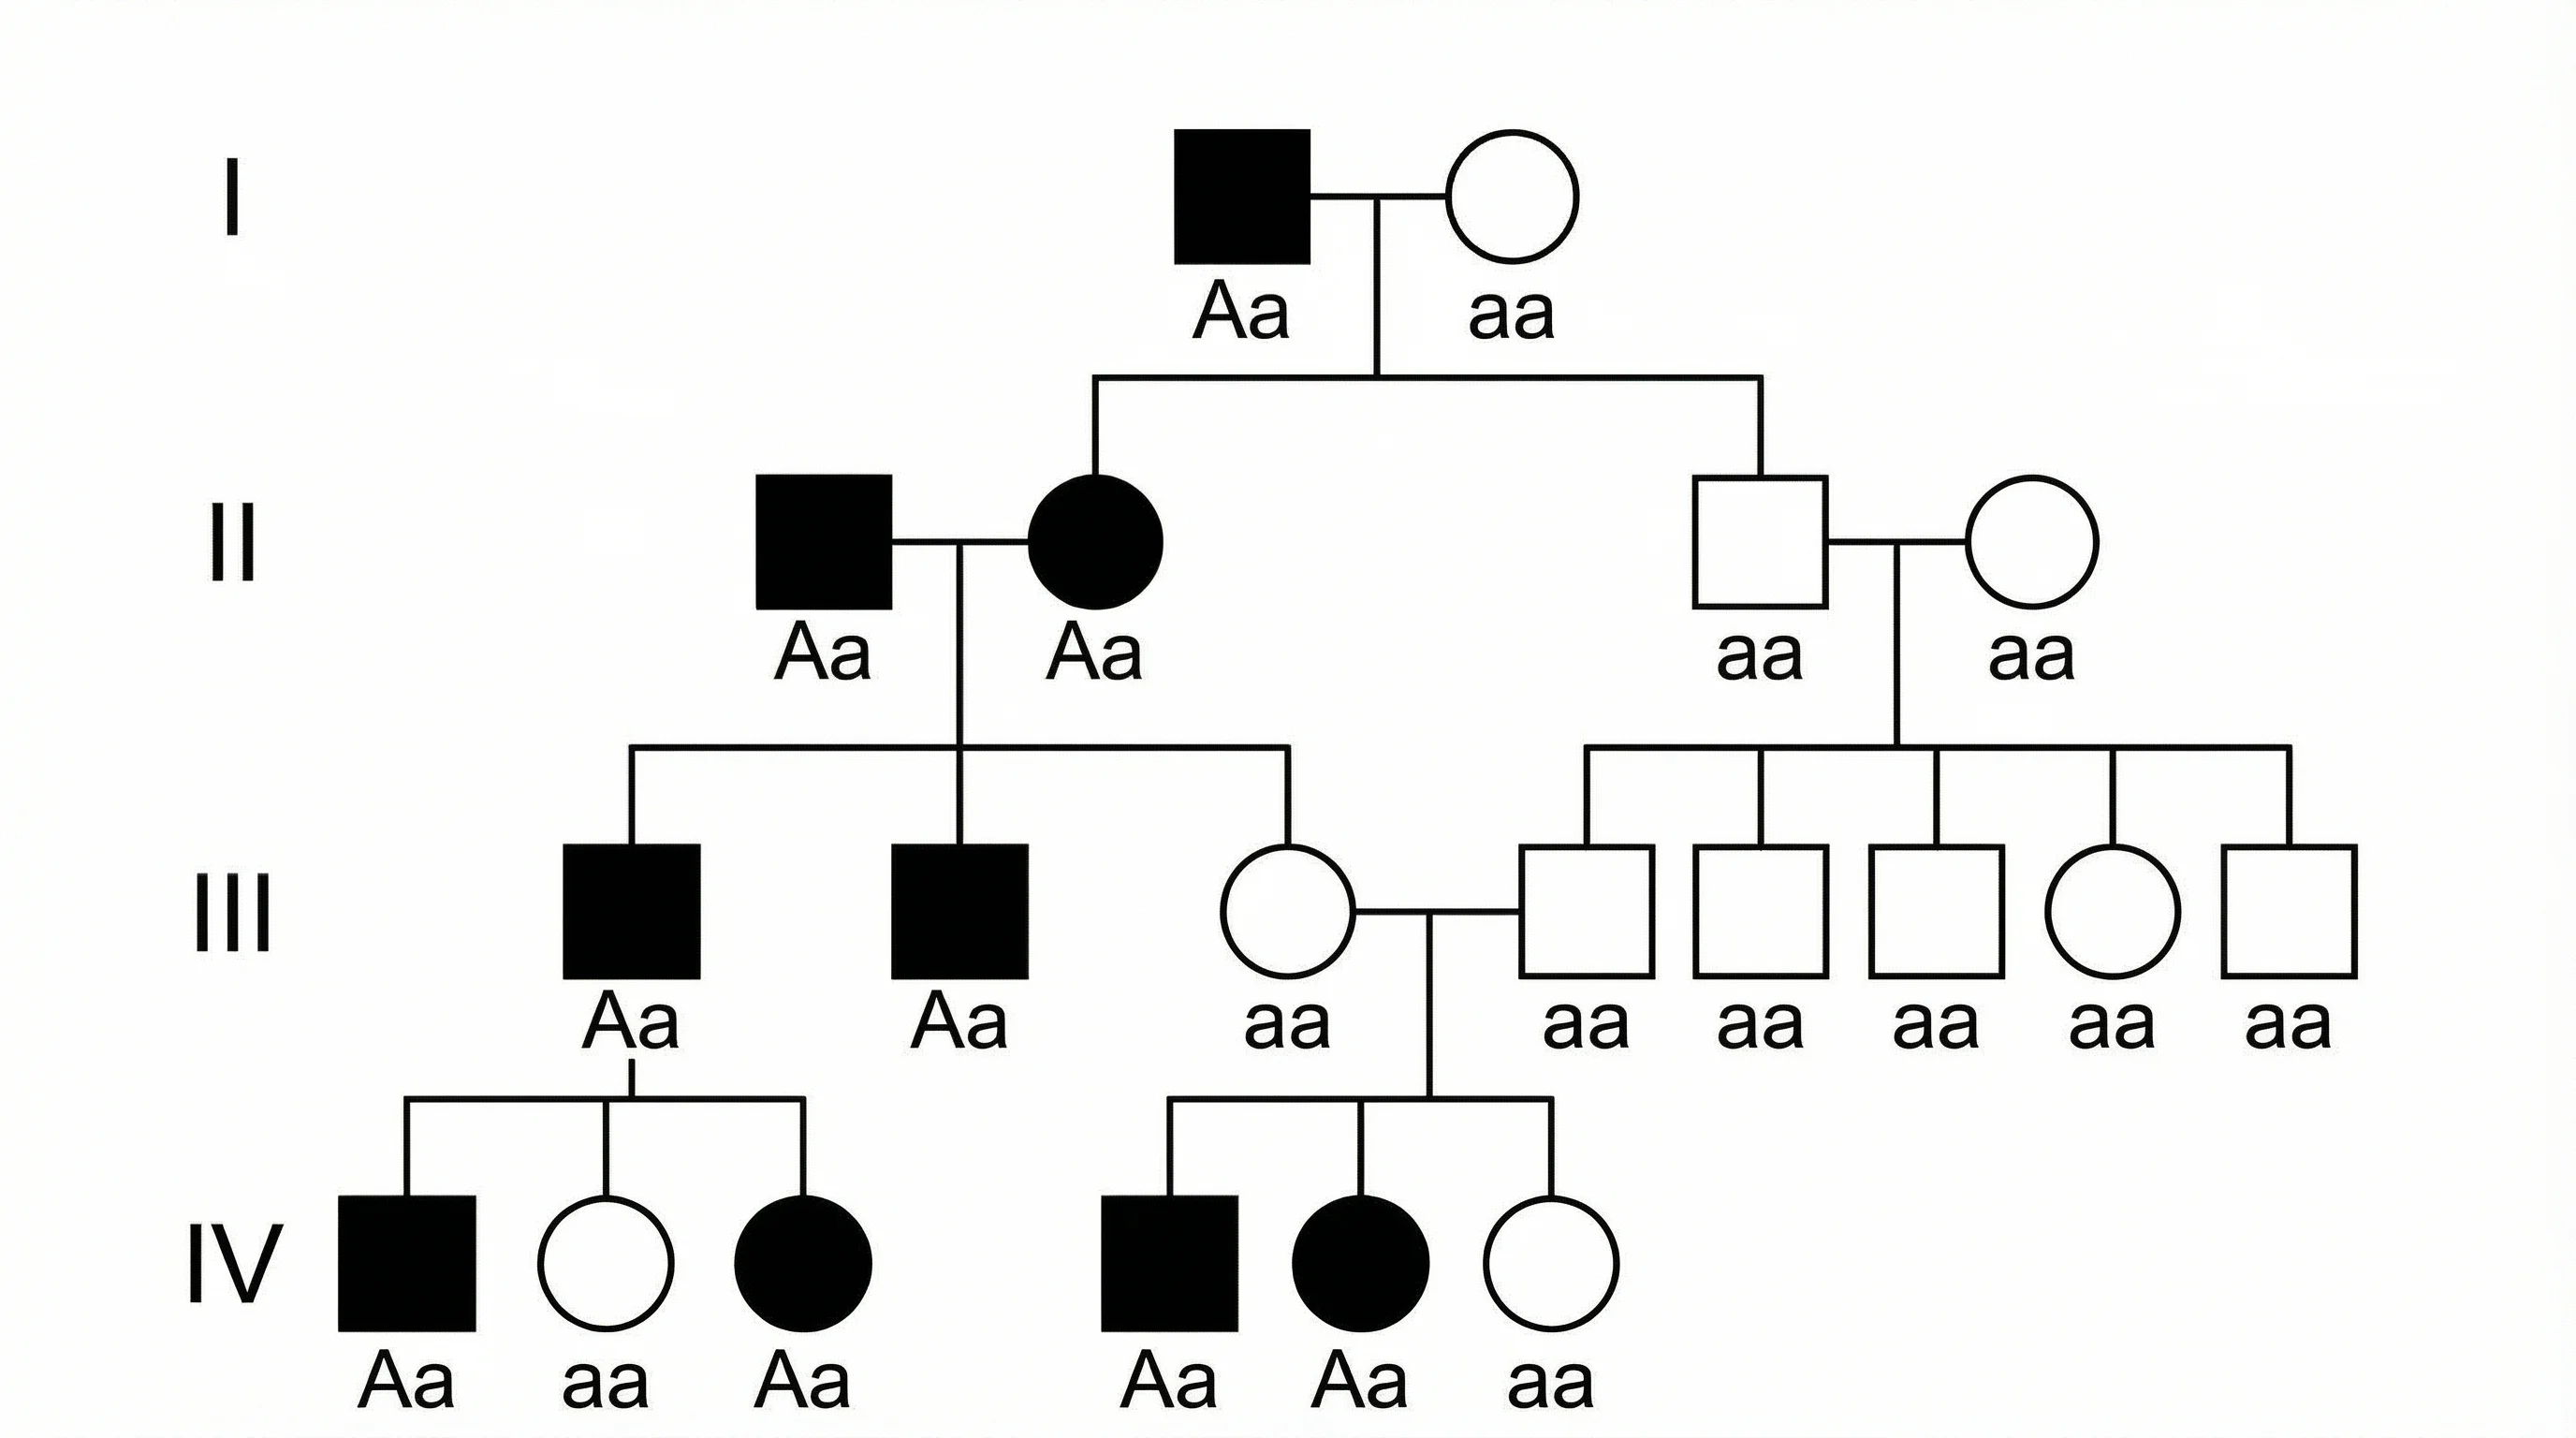
Pedigree analysis
When combined with pedigree charts, Punnett squares help determine the genotypes of family members based on observed phenotypes across generations.
Practice Problems
Problem 1
A brown-eyed parent (Bb) crosses with a blue-eyed parent (bb). What fraction of offspring will have blue eyes?
Answer: Set up a 2×2 grid. Result: 2 Bb (brown) + 2 bb (blue) = 50% blue eyes.
Problem 2
Two heterozygous tall plants (Tt) are crossed. What is the phenotype ratio?
Answer: 3 tall (TT + 2Tt) : 1 short (tt) = 3:1 ratio.
Problem 3
In a dihybrid cross of AaBb × AaBb, how many of the 16 possible offspring genotypes are homozygous for both traits (AABB or aabb)?
Answer: 1 AABB + 1 aabb = 2/16 = 12.5%.
Frequently Asked Questions
What is a Punnett square used for?
A Punnett square predicts the genotype and phenotype ratios of offspring from a genetic cross between two parents. It shows all possible allele combinations and their probabilities.
How do I make a Punnett square for two traits?
For a dihybrid cross, determine the four possible gametes from each parent (one allele from each gene per gamete), then create a 4×4 grid. Fill in each cell by combining the column and row gametes. This gives 16 possible offspring combinations.
What is the difference between genotype and phenotype?
Genotype is the genetic makeup (the alleles an organism has, like BB, Bb, or bb). Phenotype is the observable trait (like purple or white flowers). Multiple genotypes can produce the same phenotype when one allele is dominant.
What is a test cross?
A test cross breeds an organism showing the dominant phenotype with a homozygous recessive organism. If any offspring show the recessive phenotype, the tested parent must be heterozygous.
Can a Punnett square predict exact outcomes?
No. A Punnett square shows probabilities, not certainties. A 3:1 ratio means each individual offspring has a 75% chance of the dominant phenotype, but actual results in small groups may vary from the expected ratio.
What is the 9:3:3:1 ratio?
The 9:3:3:1 ratio is the expected phenotype ratio from a dihybrid cross between two double heterozygotes (e.g., RrYy × RrYy). It represents 9 dominant-dominant, 3 dominant-recessive, 3 recessive-dominant, and 1 recessive-recessive.
What is incomplete dominance in a Punnett square?
In incomplete dominance, the heterozygote shows a blended phenotype. For example, crossing red (RR) and white (WW) flowers produces pink (RW) offspring. The phenotype ratio from a heterozygous cross becomes 1:2:1 instead of 3:1.
Conclusion
Making a Punnett square follows a consistent process:
- Identify the parent genotypes
- Write one parent's alleles across the top, the other down the side
- Fill each cell by combining the column and row alleles
- Count the genotype and phenotype ratios
For monohybrid crosses, this gives you a 2×2 grid with 4 combinations. For dihybrid crosses, a 4×4 grid with 16 combinations. The logic is the same — only the grid size changes.
The Punnett square is a probability tool, not a prediction guarantee. But for learning Mendelian genetics, it makes inheritance patterns visible and concrete in a way that abstract rules alone cannot match.
For generating genetics diagrams and science visuals, try ConceptViz Pedigree Chart Maker or the AI Scientific Image Generator.
Additional Resources:
- Practice with Punnett Squares – Teach Genetics (Utah)
- Punnett Squares – Biology LibreTexts
- Punnett Square Calculator – Science Primer
- How to Solve Punnett Squares – Biology Corner
- Punnett Square – Wikipedia
- Biology Drawing Guide
- Plant Cell vs Animal Cell Differences Guide
- Scientific Illustration Complete Beginners Guide
Categorías
Más Publicaciones

Supply and Demand Graph: Equilibrium & Shifts
Learn how to read the supply and demand graph: why demand slopes down and supply slopes up, where they meet at equilibrium, plus shifts, surplus, and shortage.
")
Biology Drawing Guide: Create Scientific Diagrams (2026)
Learn how to create accurate biology drawings and scientific diagrams. Covers cell diagrams, organism drawings, labeling techniques, and AI-powered tools.

10 Mejores Alternativas a Miro Gratis en 2026: Pizarras y Colaboracion
Compara las mejores alternativas gratuitas a Miro en 2026: Excalidraw, FigJam, Canva Whiteboard y mas. Pizarras ilimitadas, colaboracion en tiempo real y menos restricciones.