Blog
Consejos de enseñanza, comparaciones de herramientas y guías de diagramas científicos para educadores STEM. Crea mejores materiales para el aula con generación de diagramas con IA.
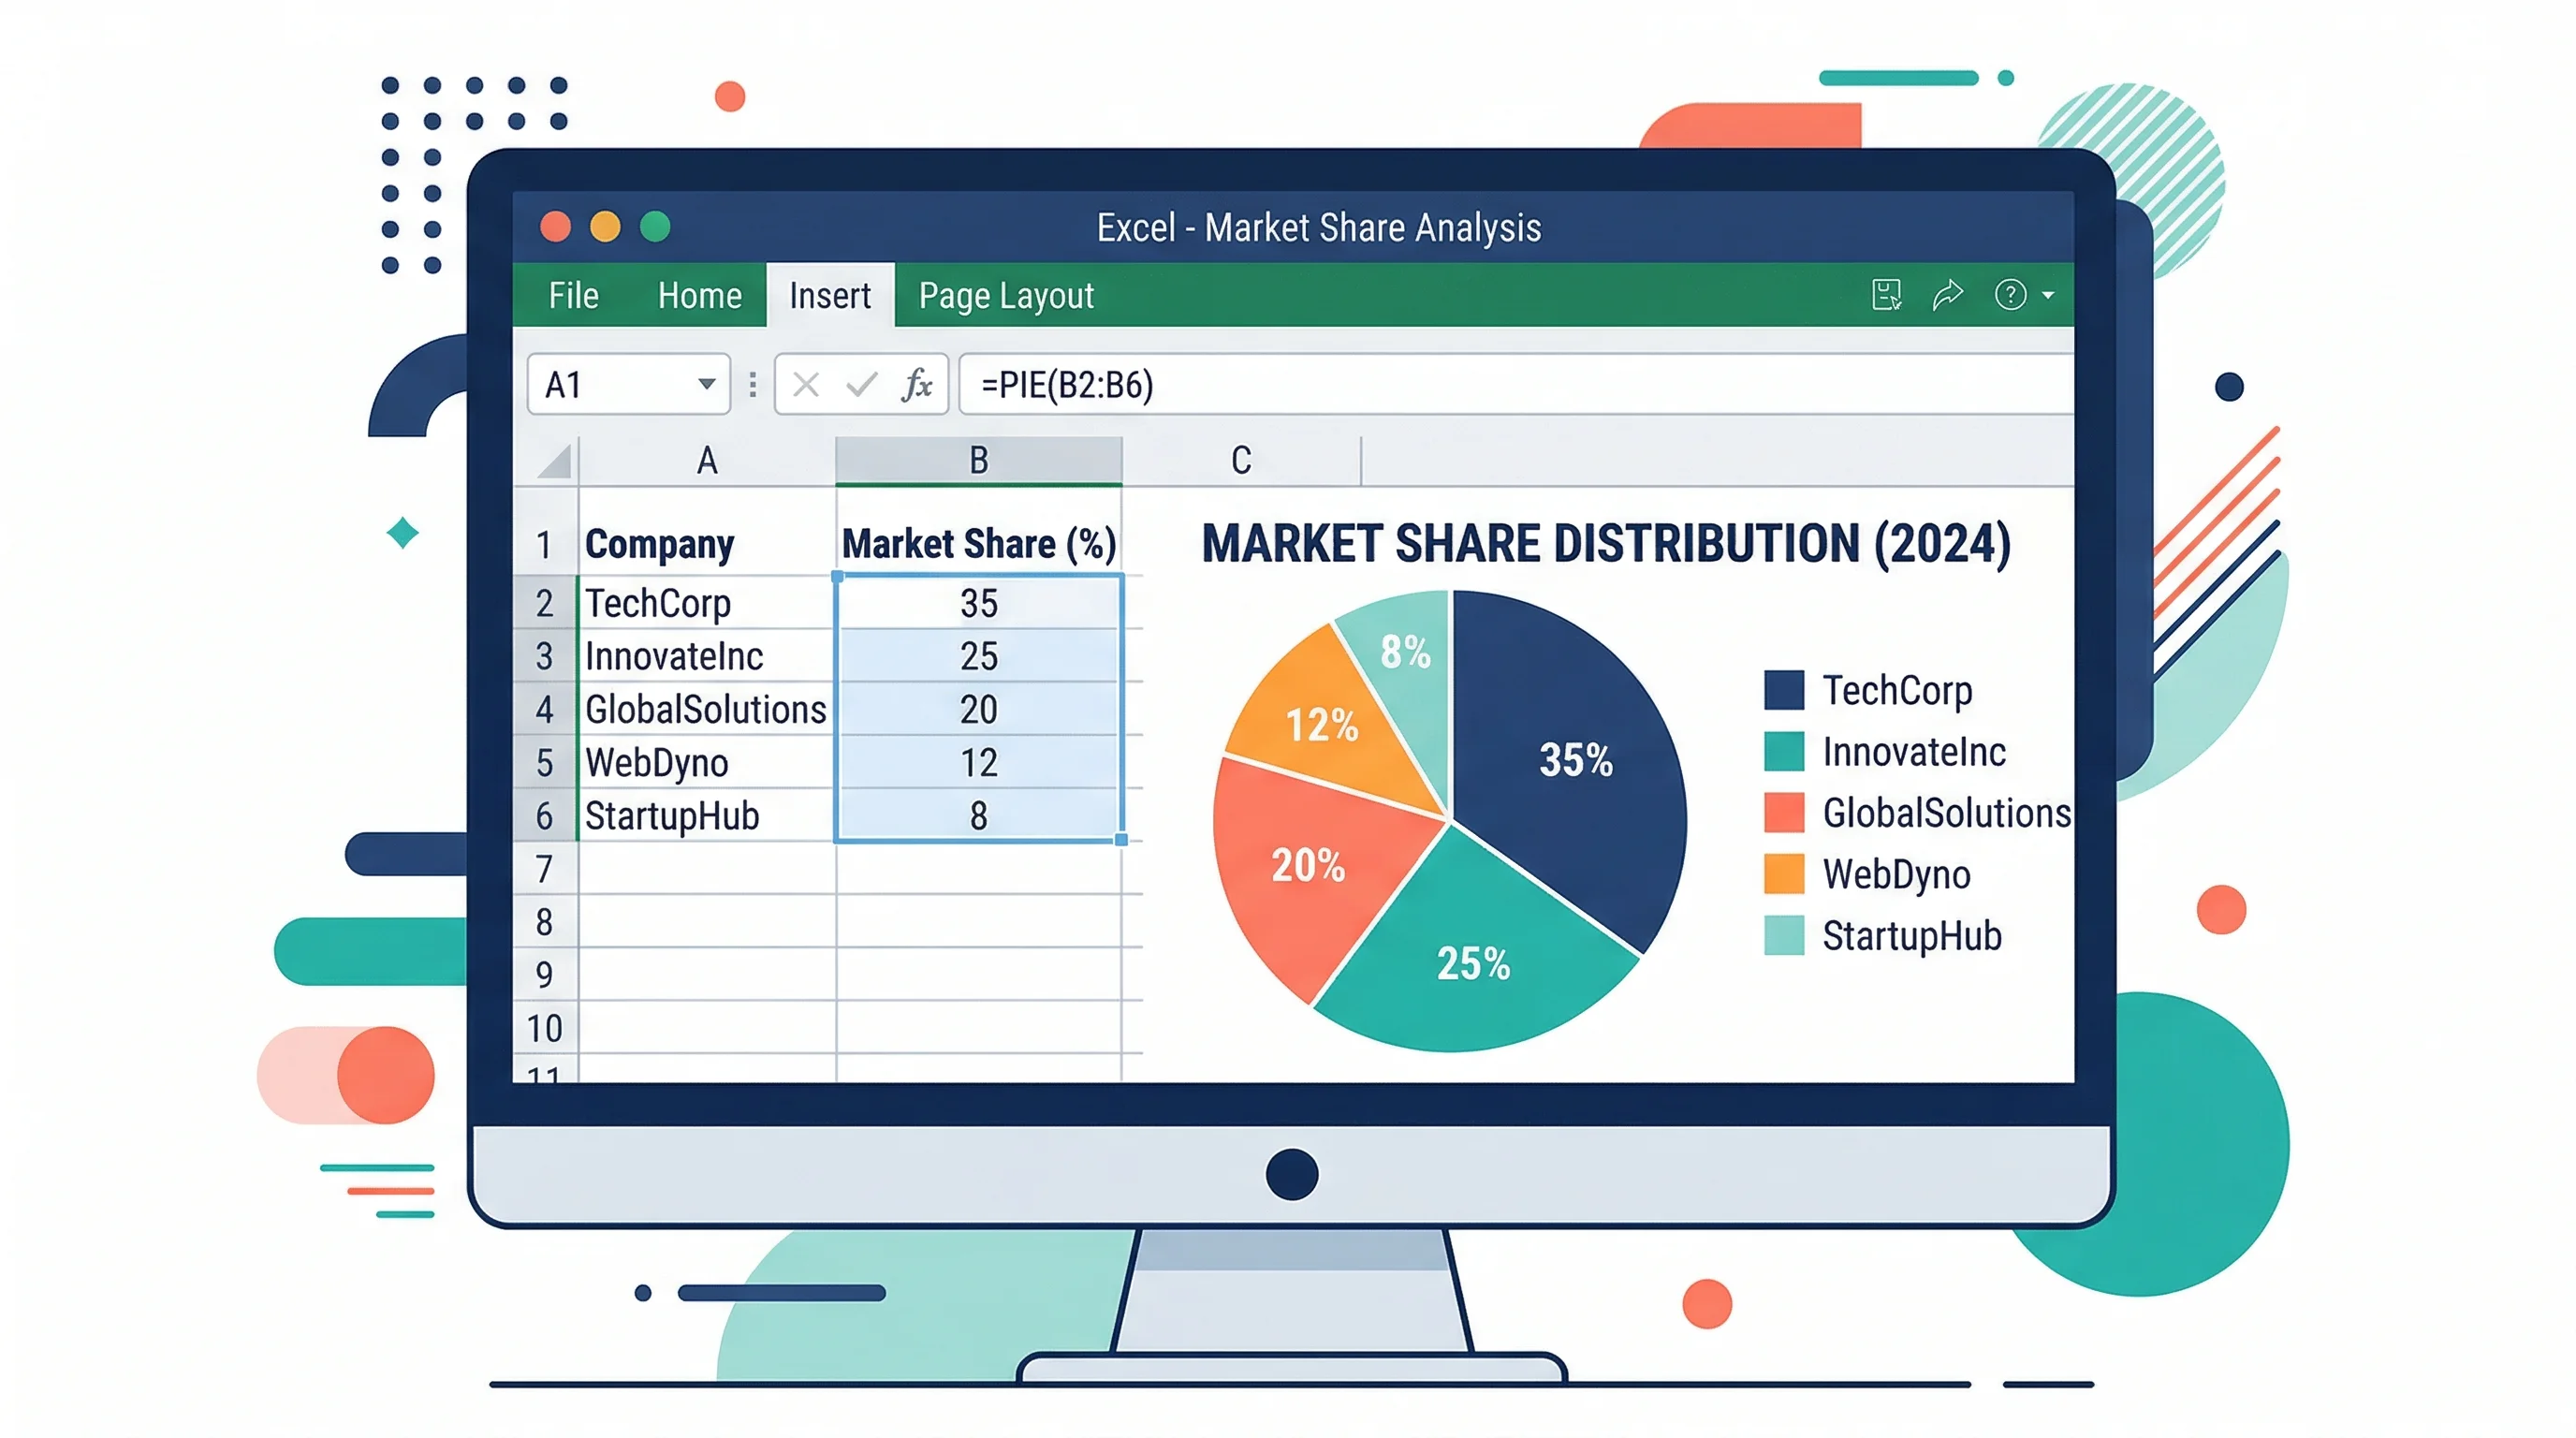
How to Make a Pie Chart in Excel: Step-by-Step Guide (2026)
Learn how to create a pie chart in Excel, format labels, choose better colors, and avoid misleading slices. Includes Excel 365, 2024, 2021, and 2019 workflows.
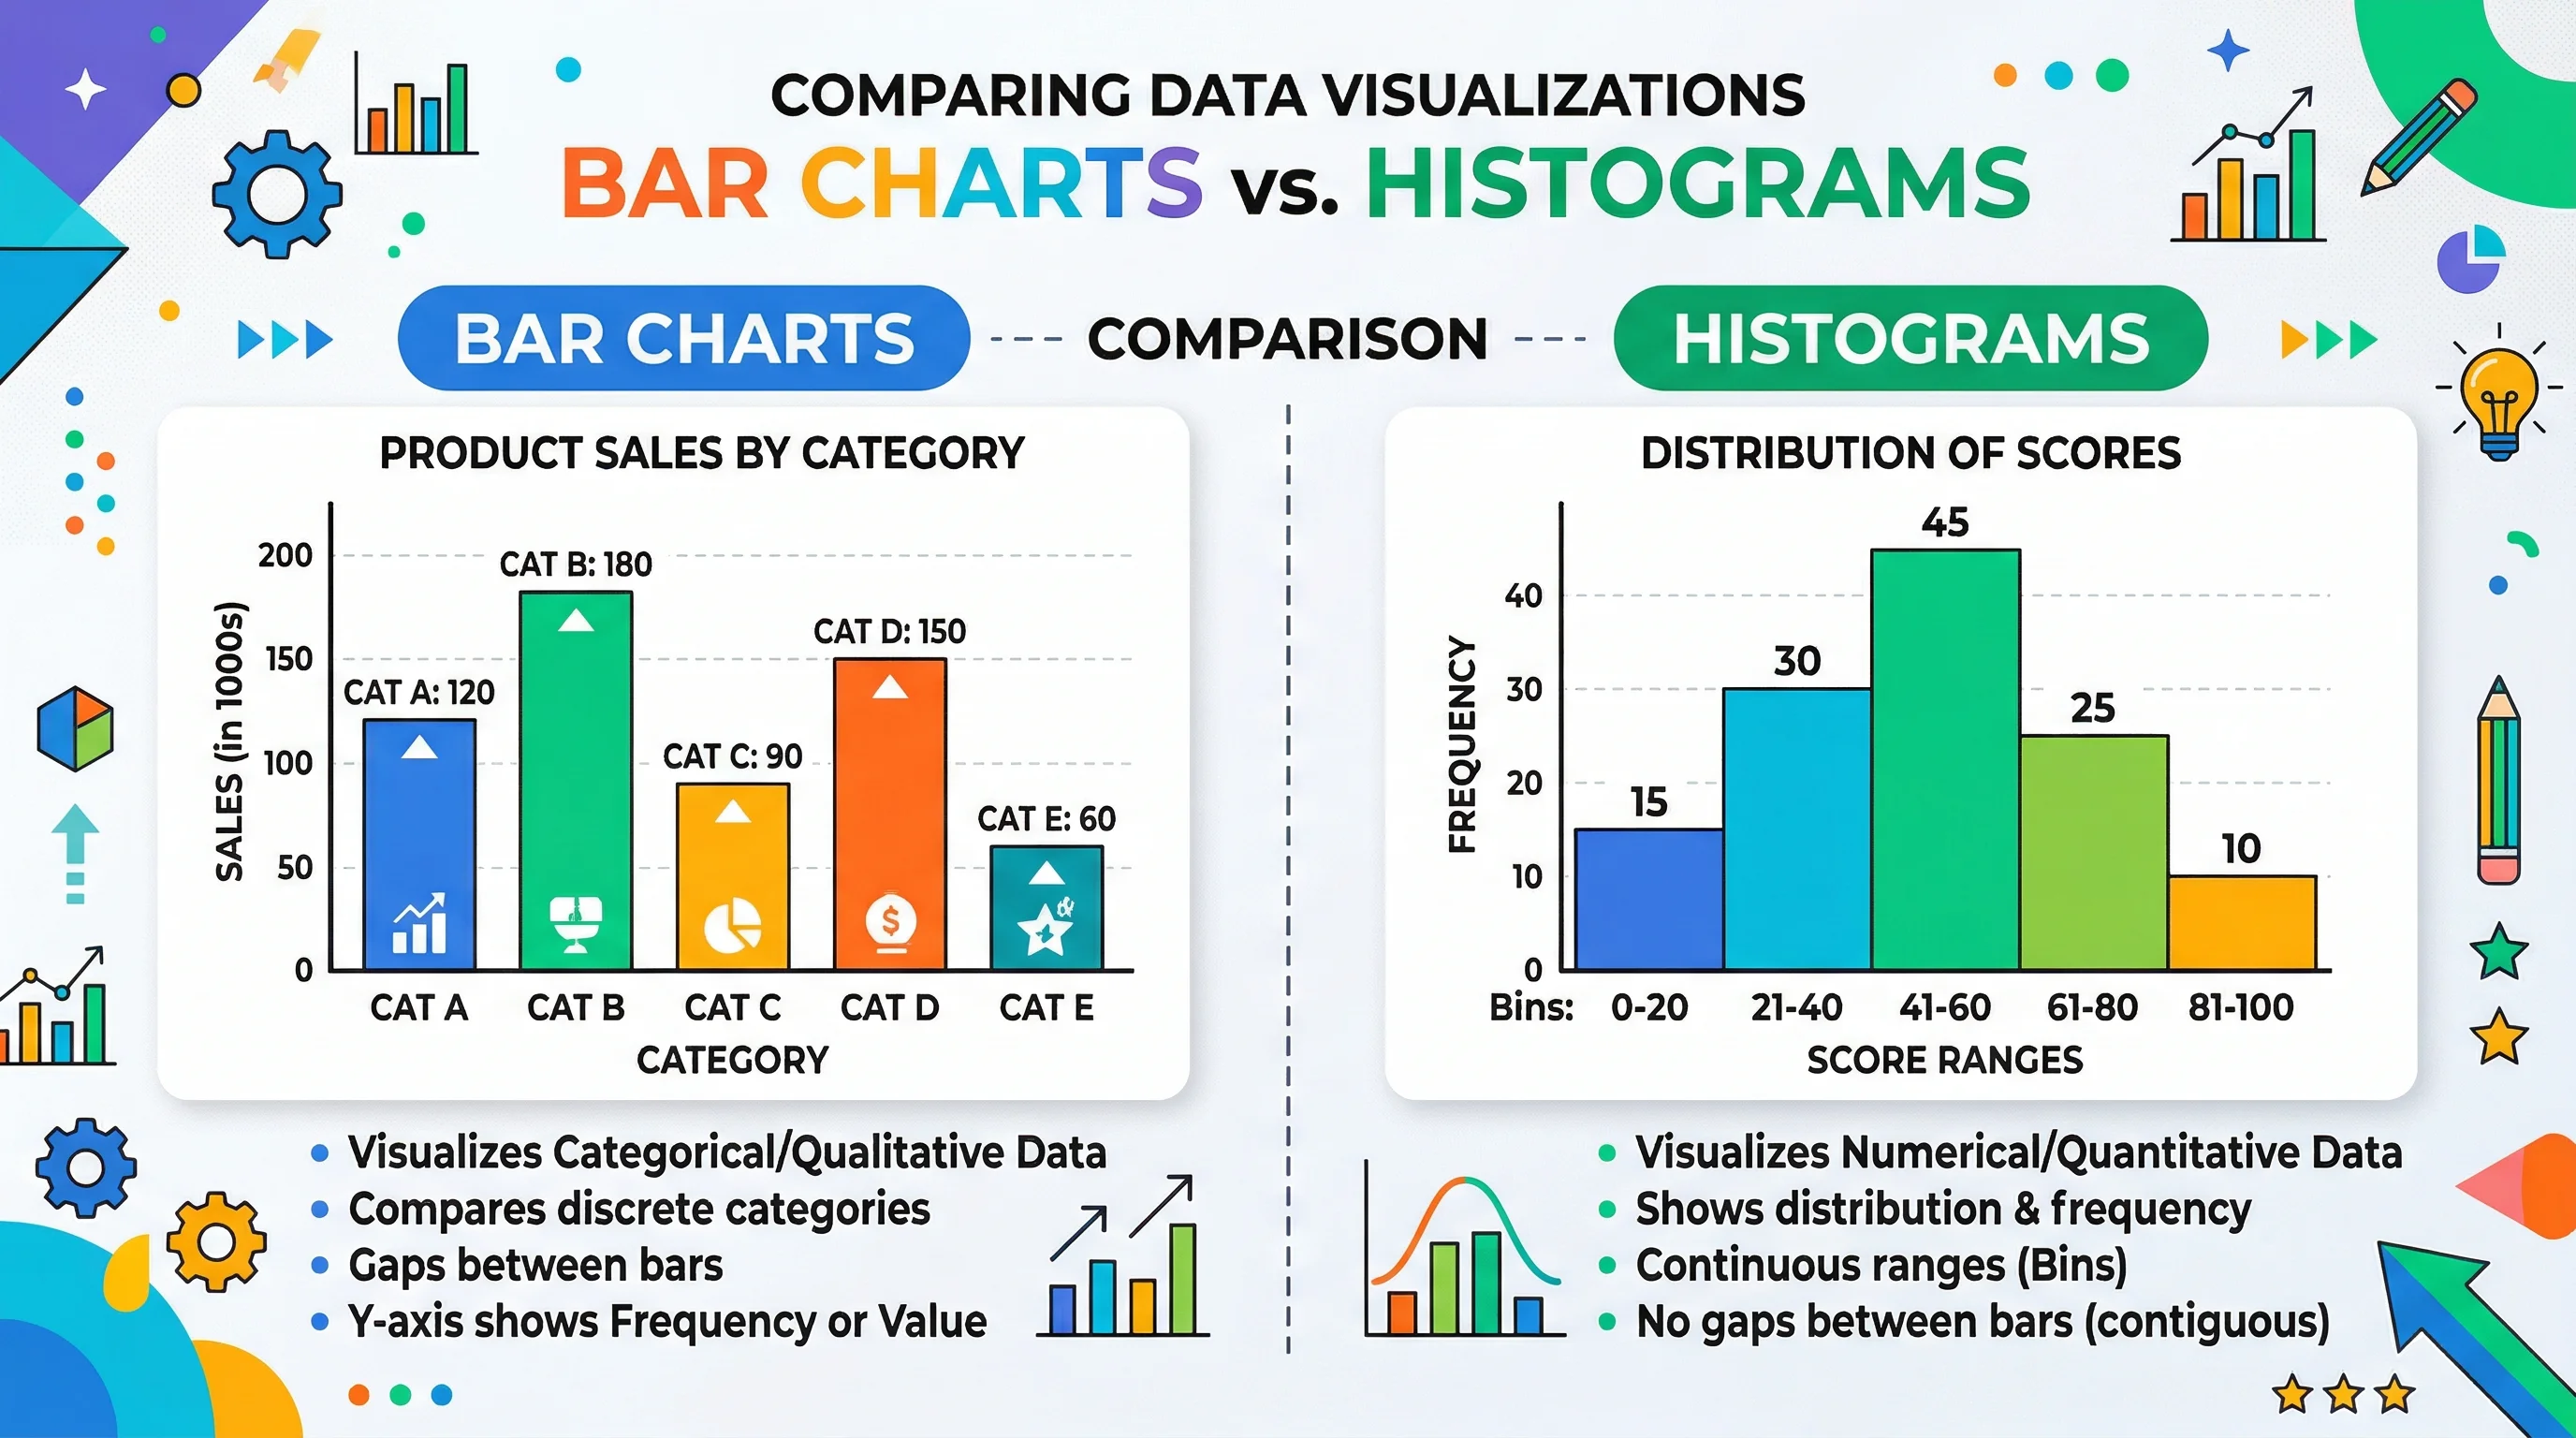
Bar Chart vs Histogram: Key Differences Explained
Learn the real difference between bar charts and histograms with clear examples. Covers when to use each, common mistakes, and how to create both quickly.
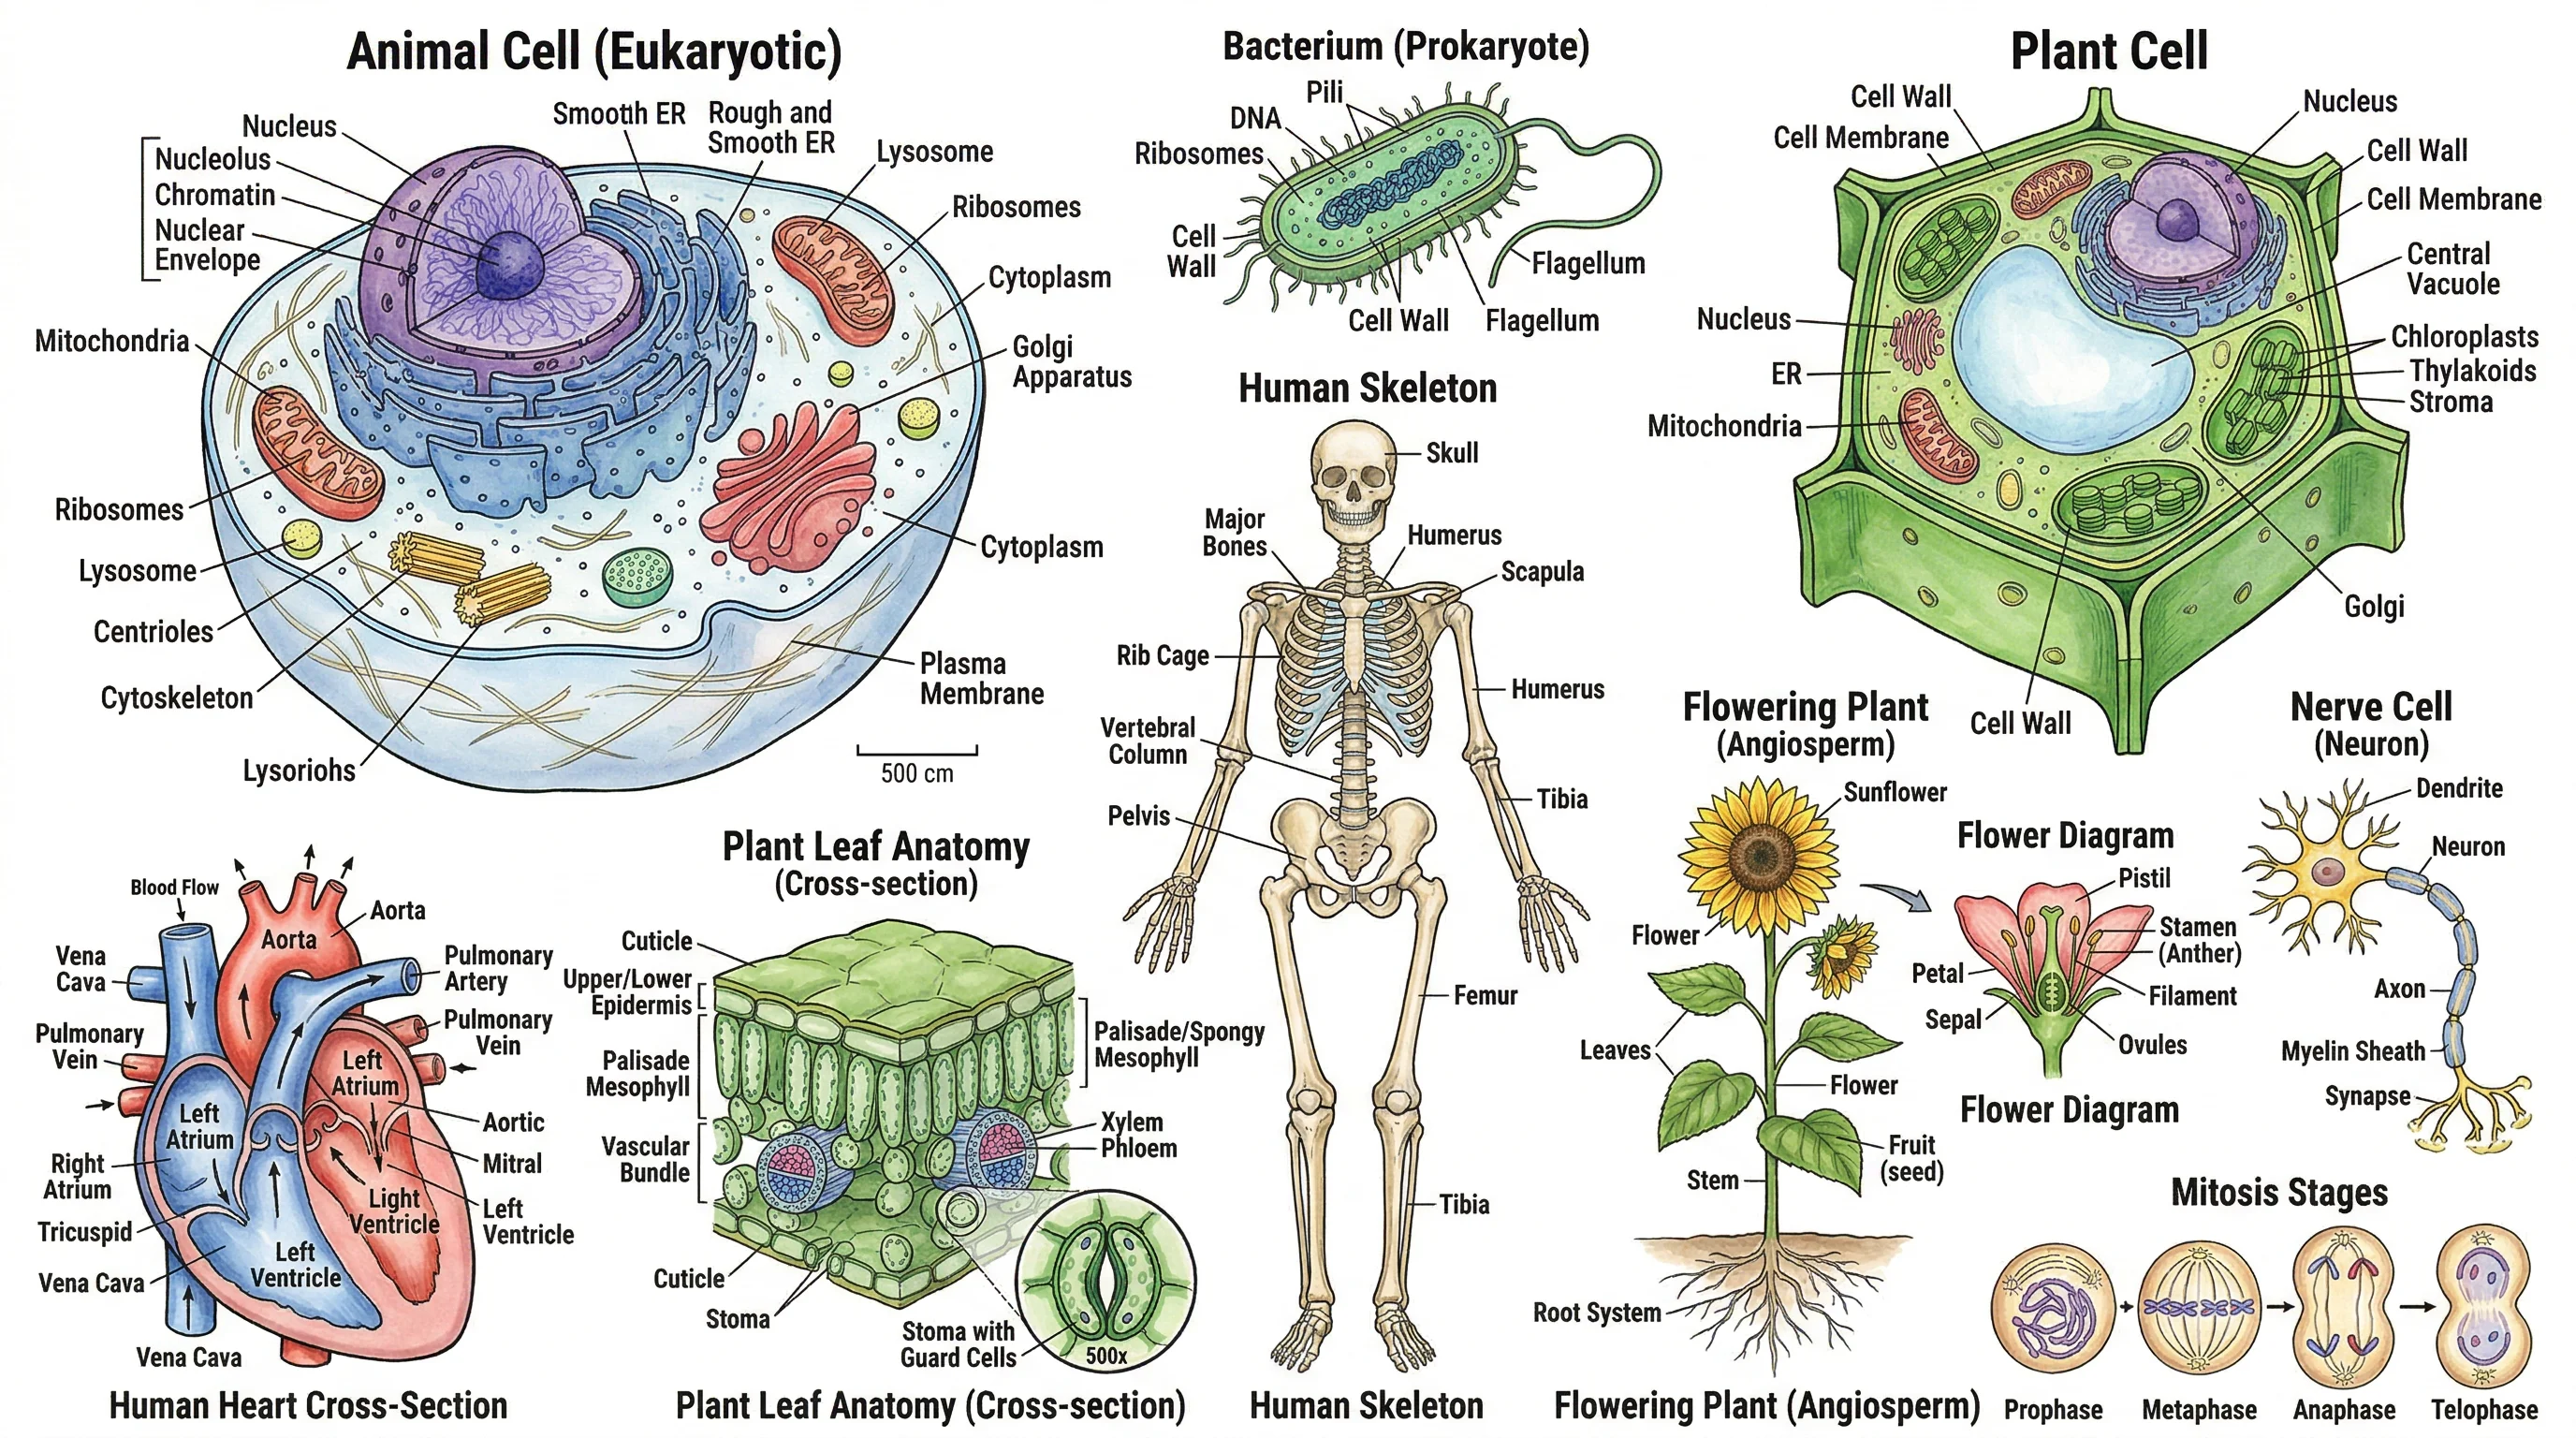
Biology Drawing Guide: Create Scientific Diagrams (2026)
Learn how to create accurate biology drawings and scientific diagrams. Covers cell diagrams, organism drawings, labeling techniques, and AI-powered tools.
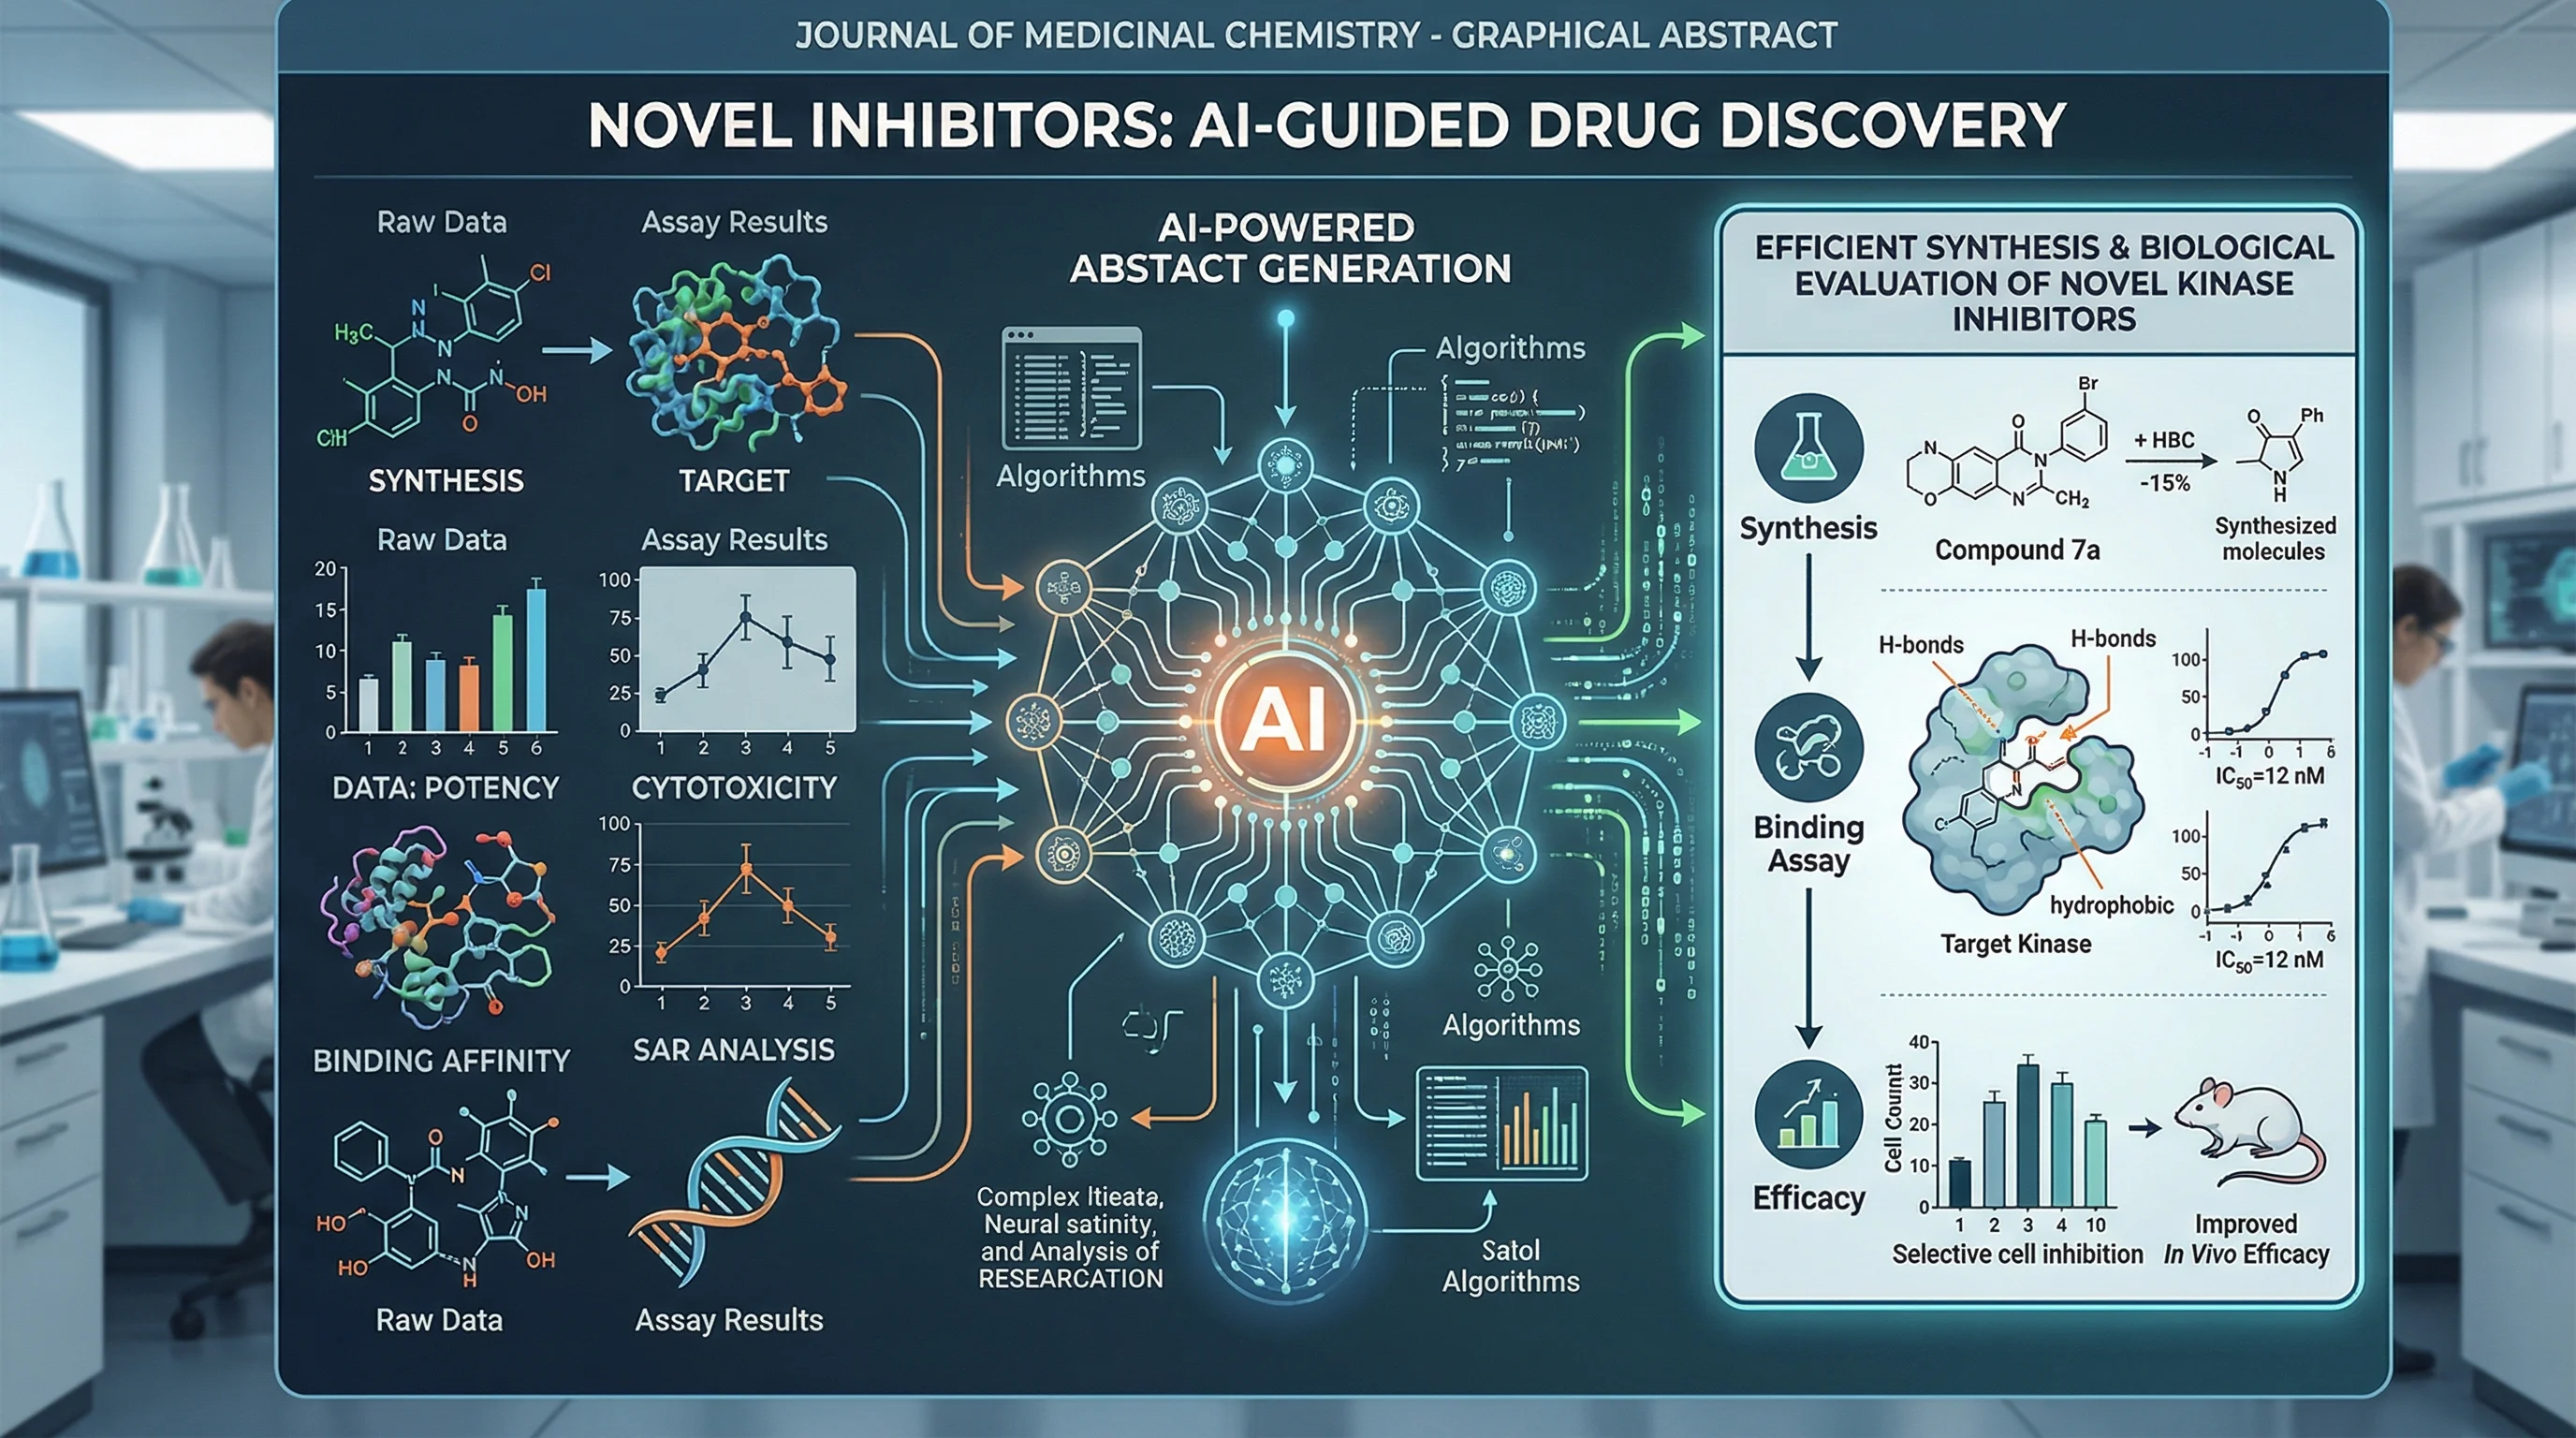
Free AI Graphical Abstract Makers for Research Papers (2026)
Compare the best free AI graphical abstract makers for researchers. Create journal-ready visual abstracts for Elsevier, Cell & Nature, no design skills needed.
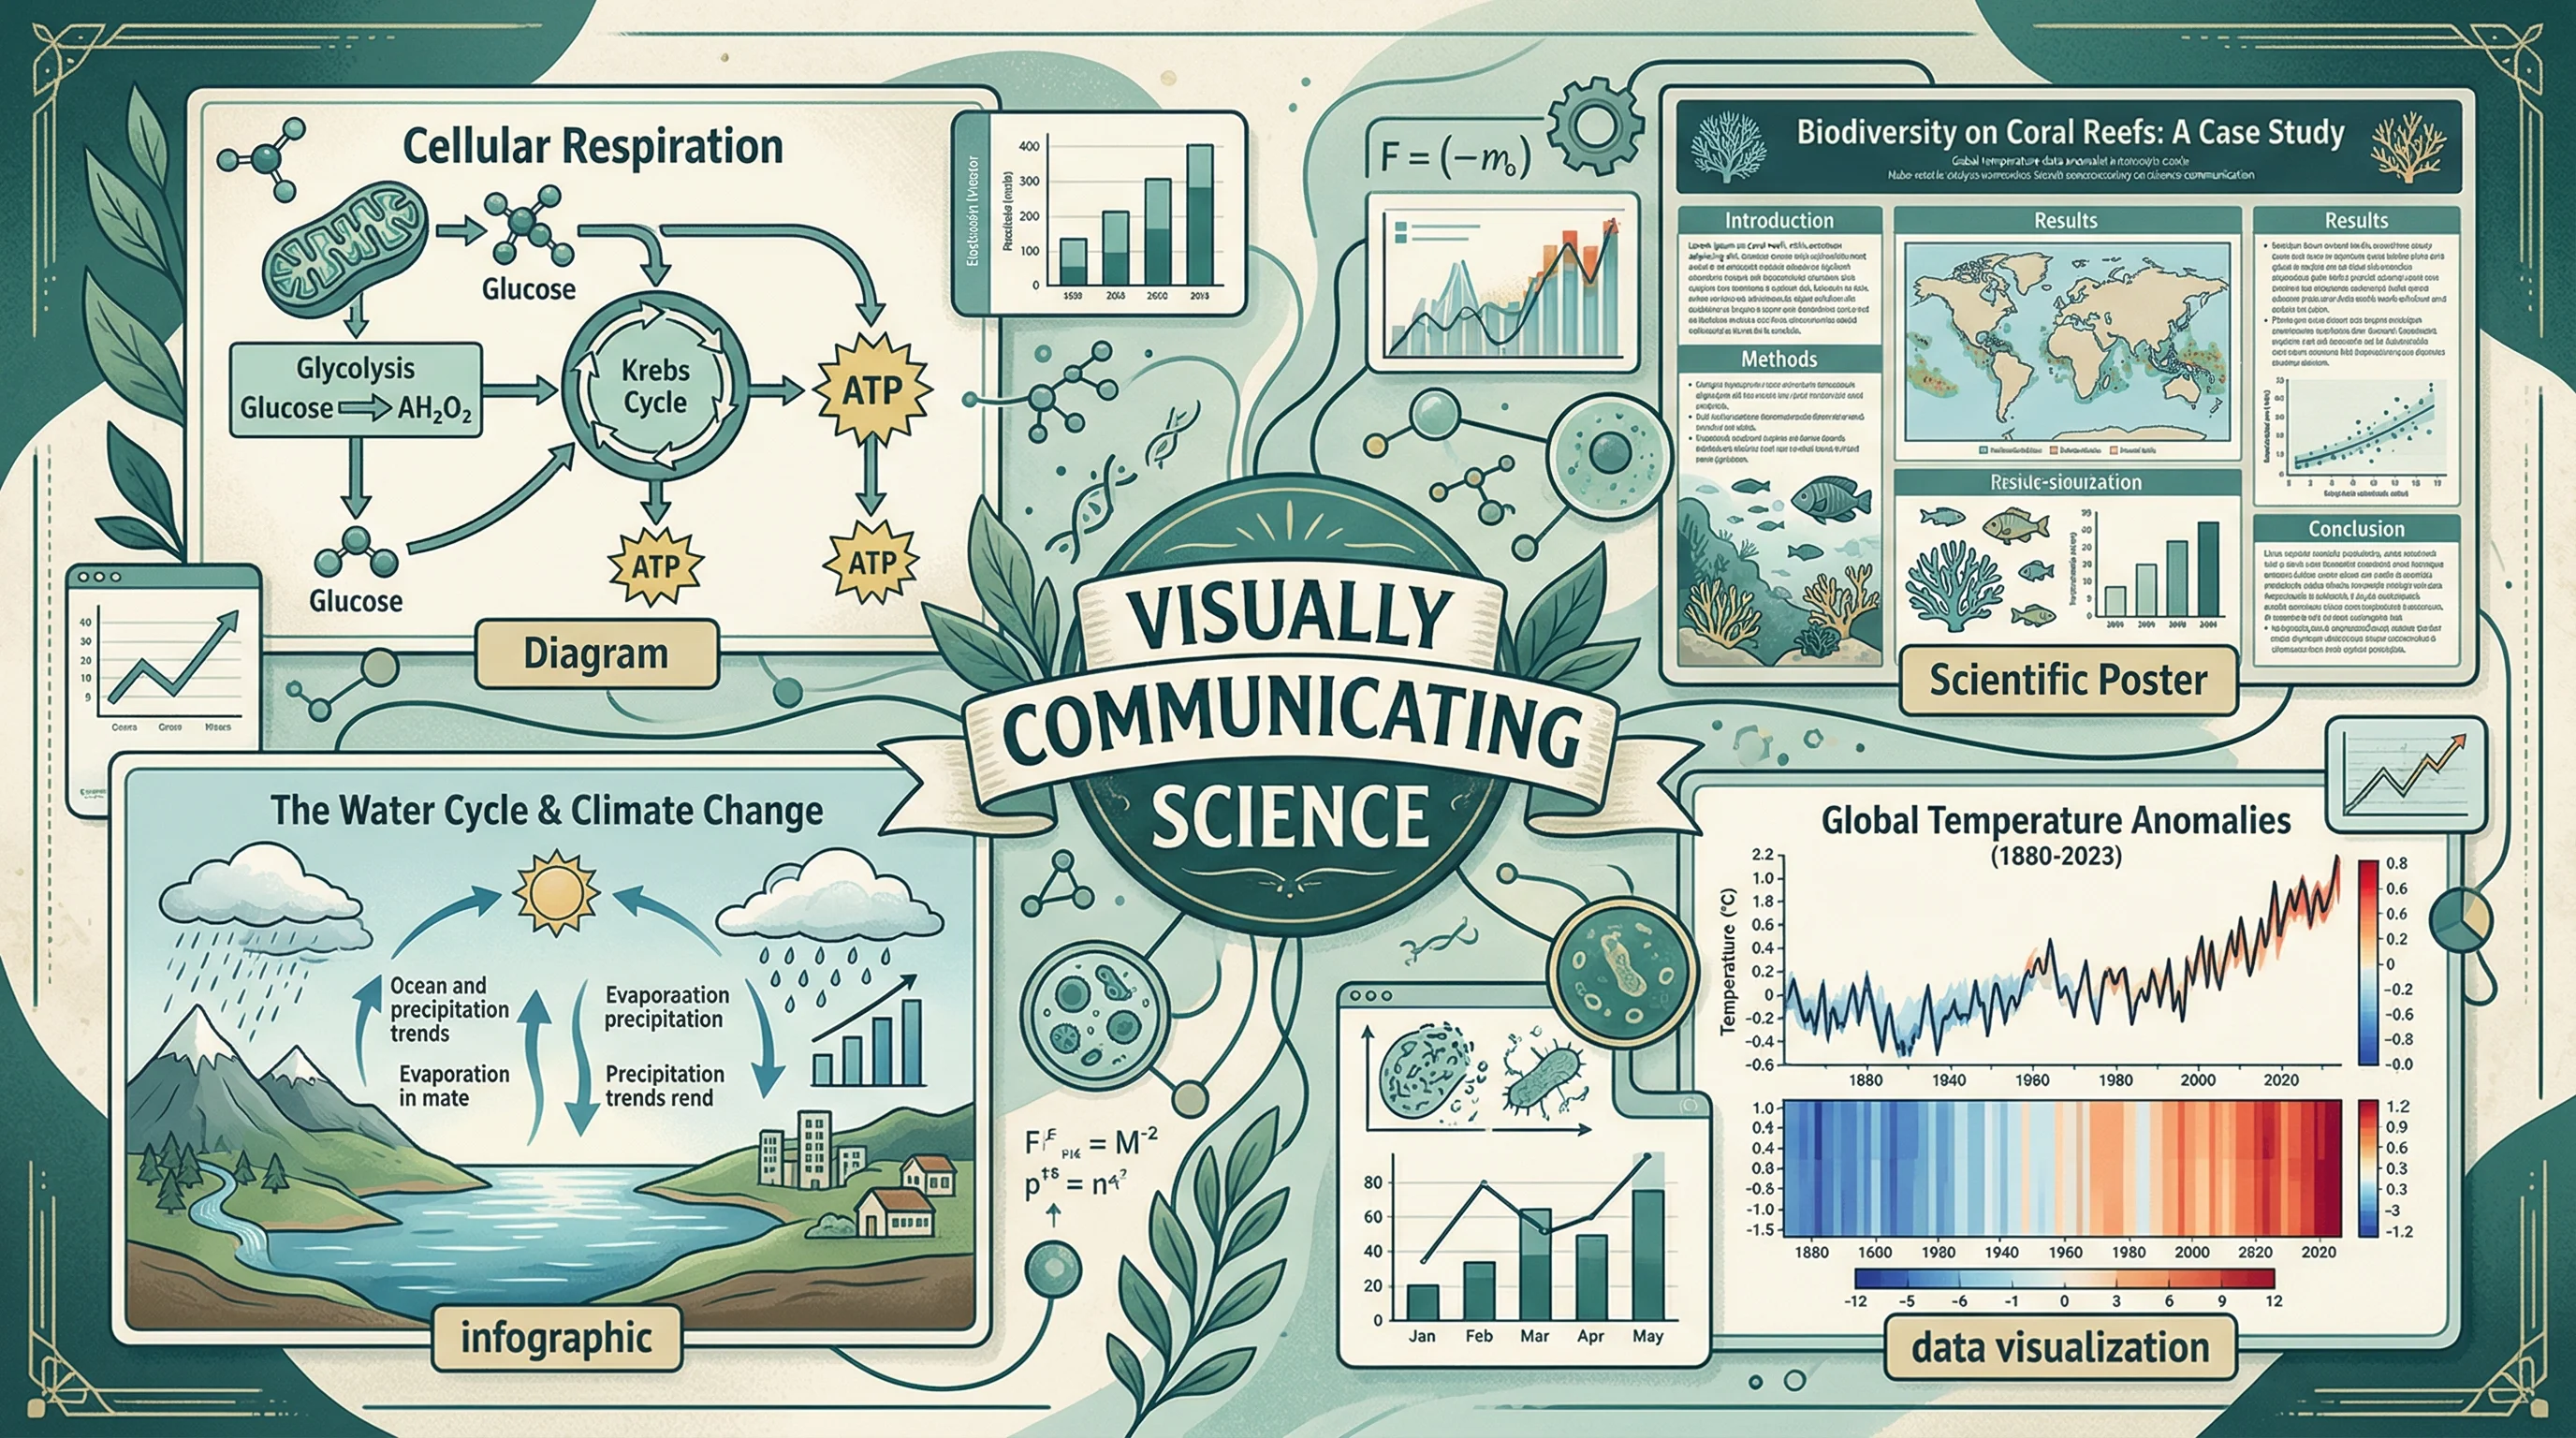
How to Illustrate Science: Methods, Tools & Examples (2026)
Learn 8 proven ways to illustrate science for research papers, posters, and presentations. Covers diagrams, infographics, graphical abstracts, and more.
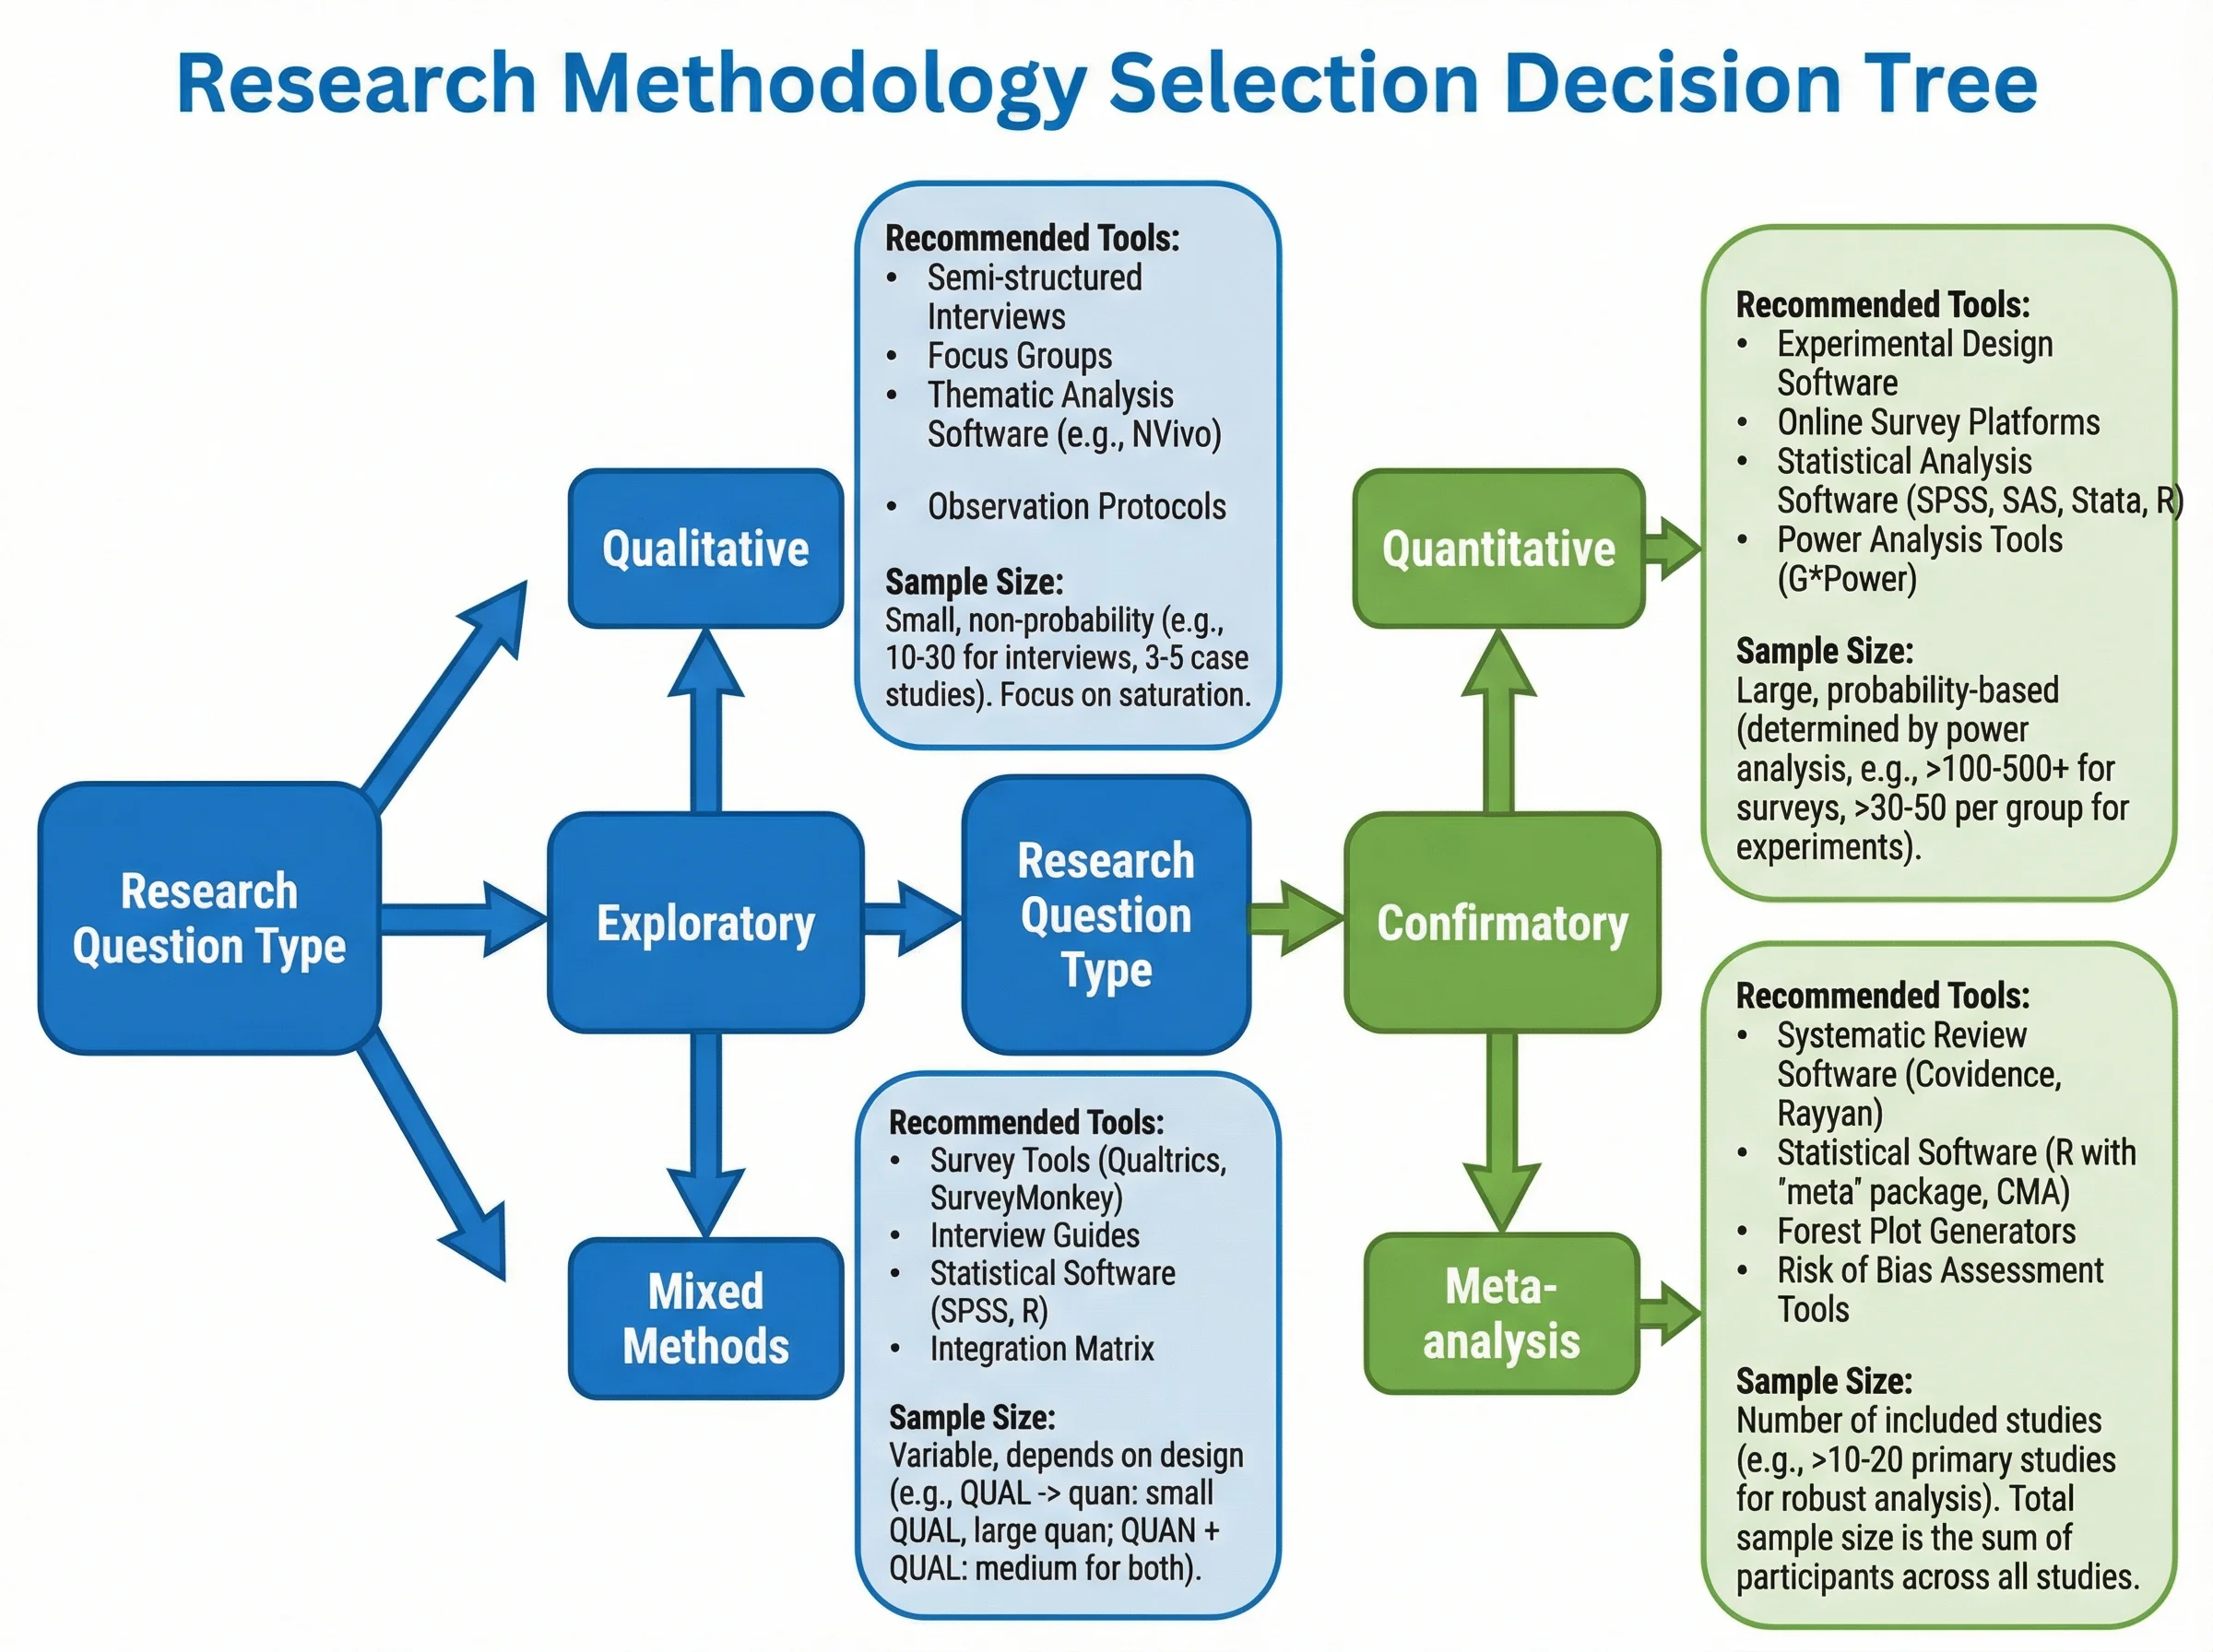
How to Create a Tree Diagram: 5 Types, Examples & Free AI Generator (2026)
Learn how to create tree diagrams for probability, decisions, org charts, and more. Step-by-step guide with real examples — plus a free AI tree diagram maker.