Блог
Советы преподавателям, сравнение инструментов и руководства по научным диаграммам для преподавателей STEM. Создавайте лучшие учебные материалы с помощью ИИ.
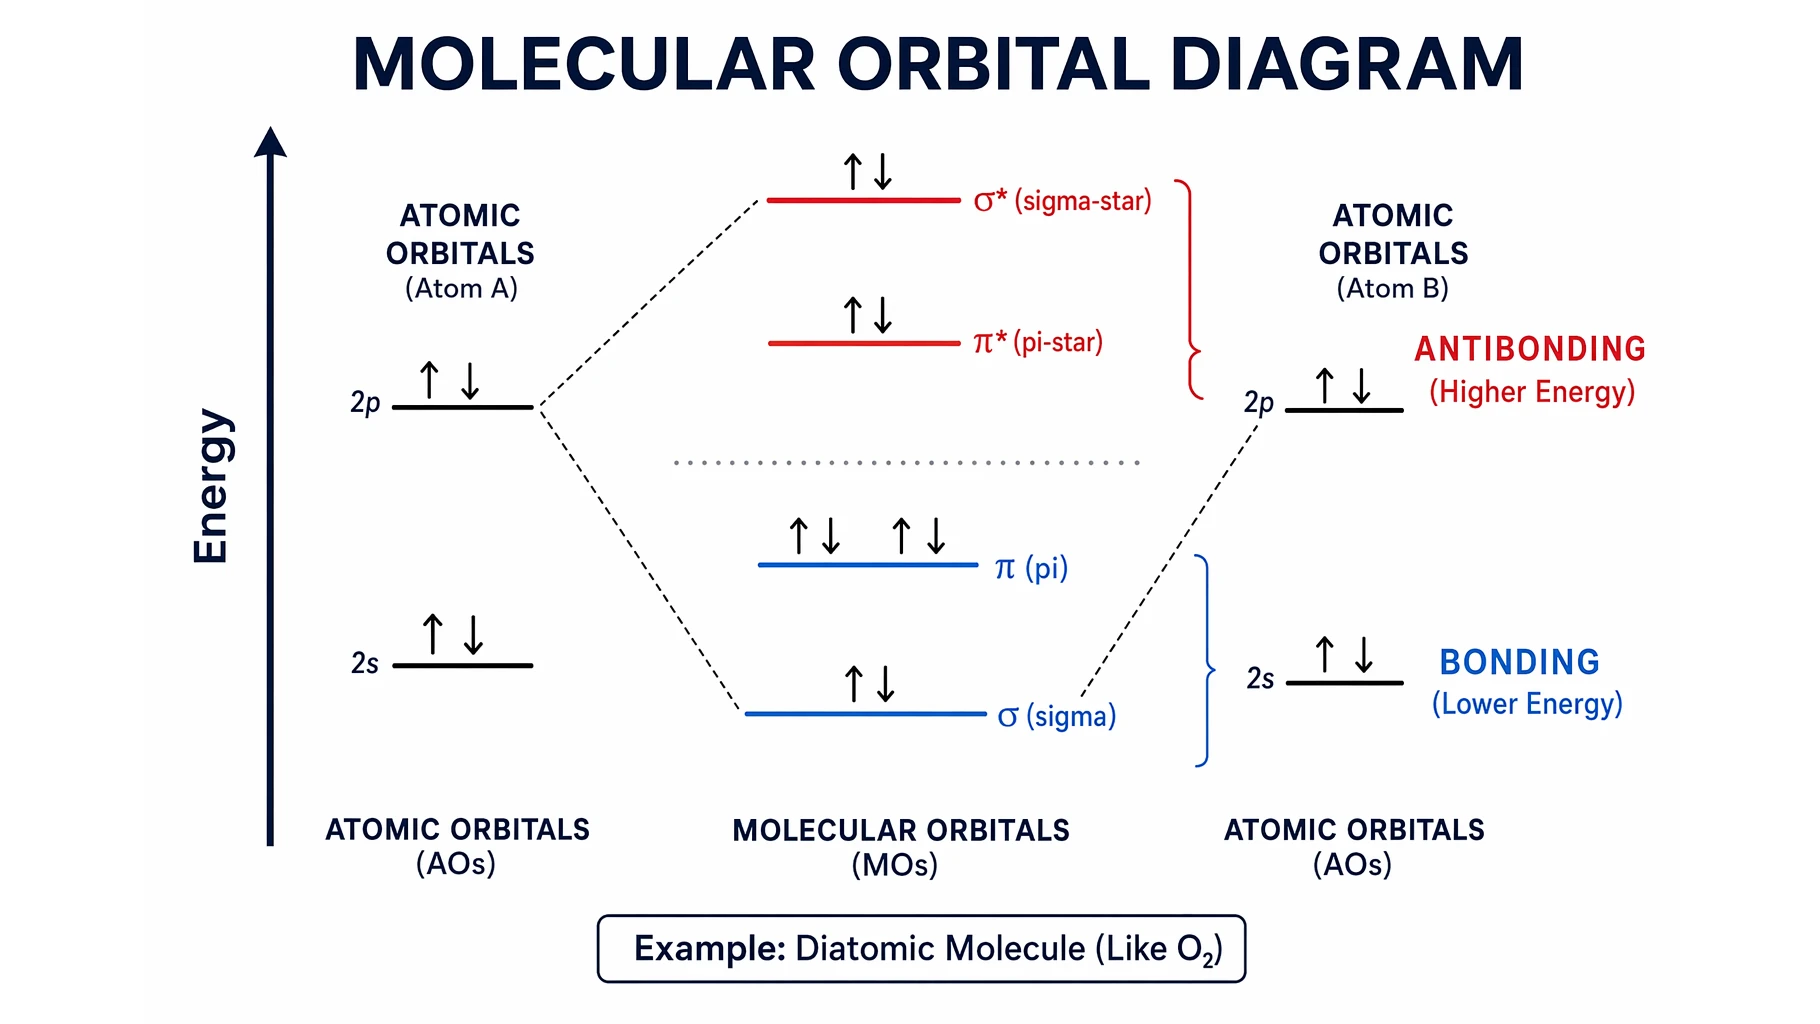
Molecular Orbital Diagrams Explained: Bonding & Bond Order
Learn how to read and draw a molecular orbital diagram: bonding vs antibonding orbitals, filling electrons, and bond order, with H2, N2, and O2 examples.
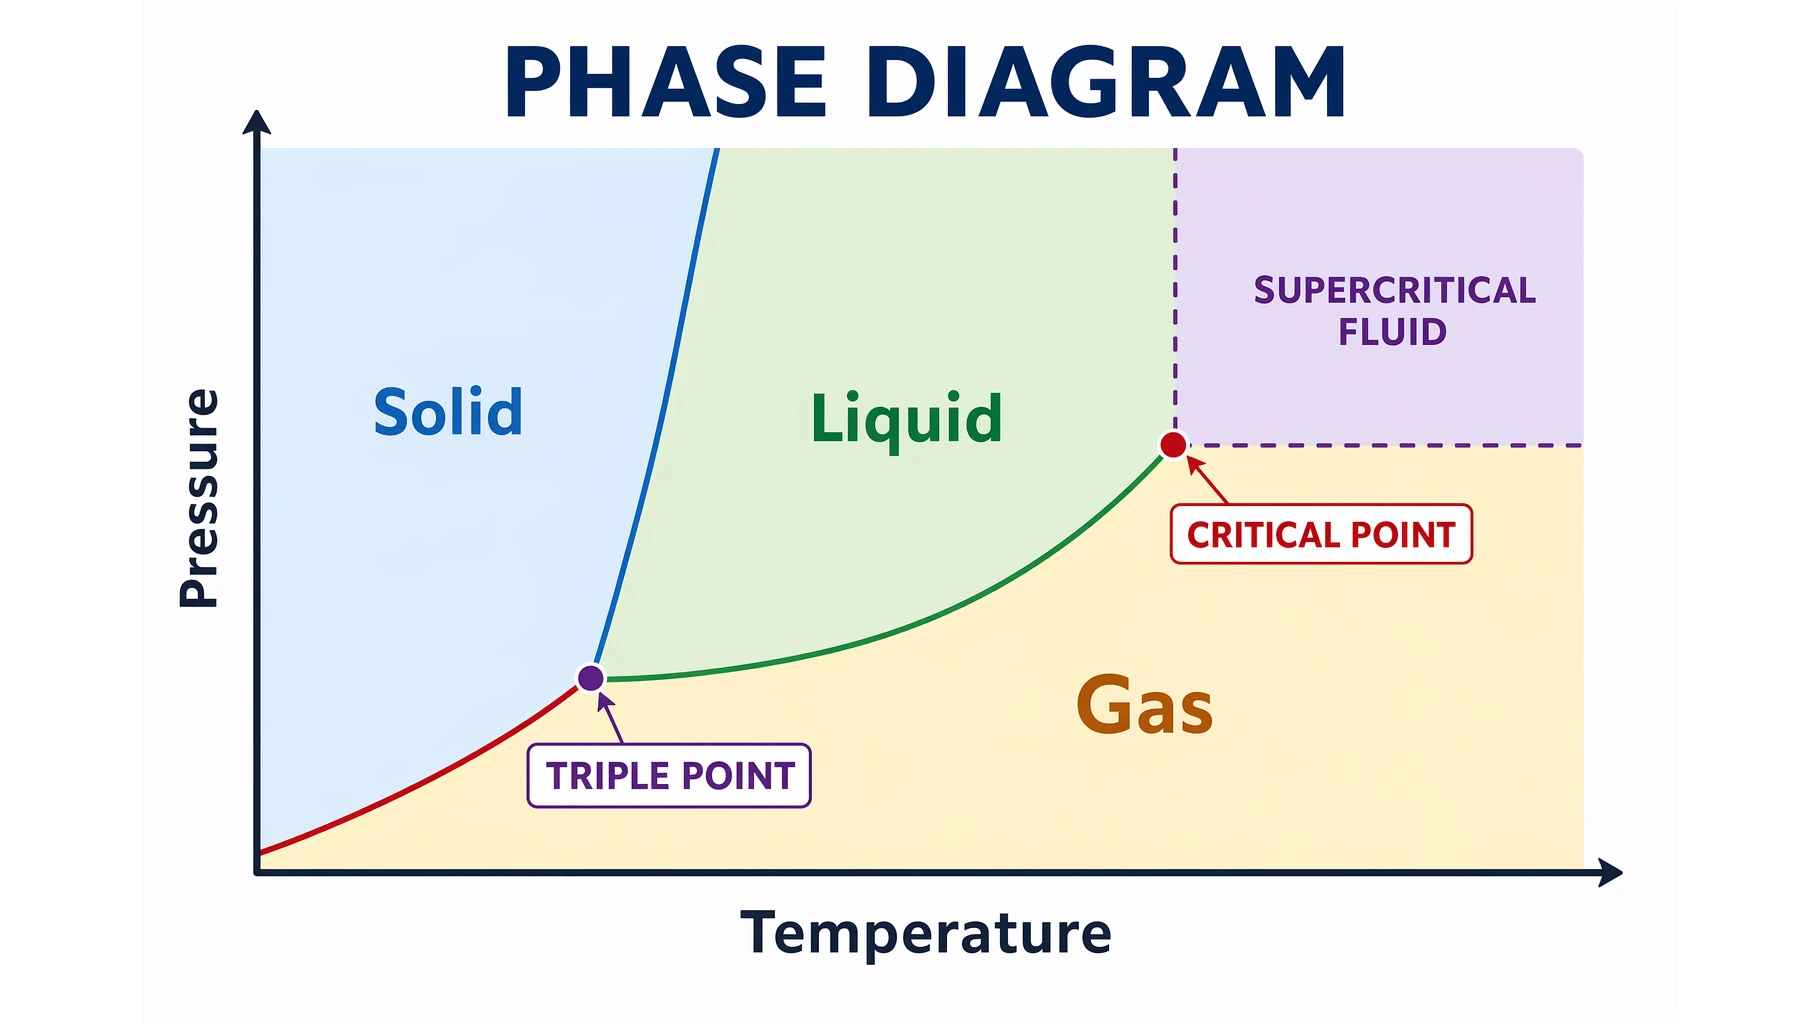
Phase Diagrams Explained: Triple Point & Critical Point
Learn how to read a phase diagram: the solid, liquid, and gas regions, melting, boiling, and sublimation curves, and the triple and critical points.
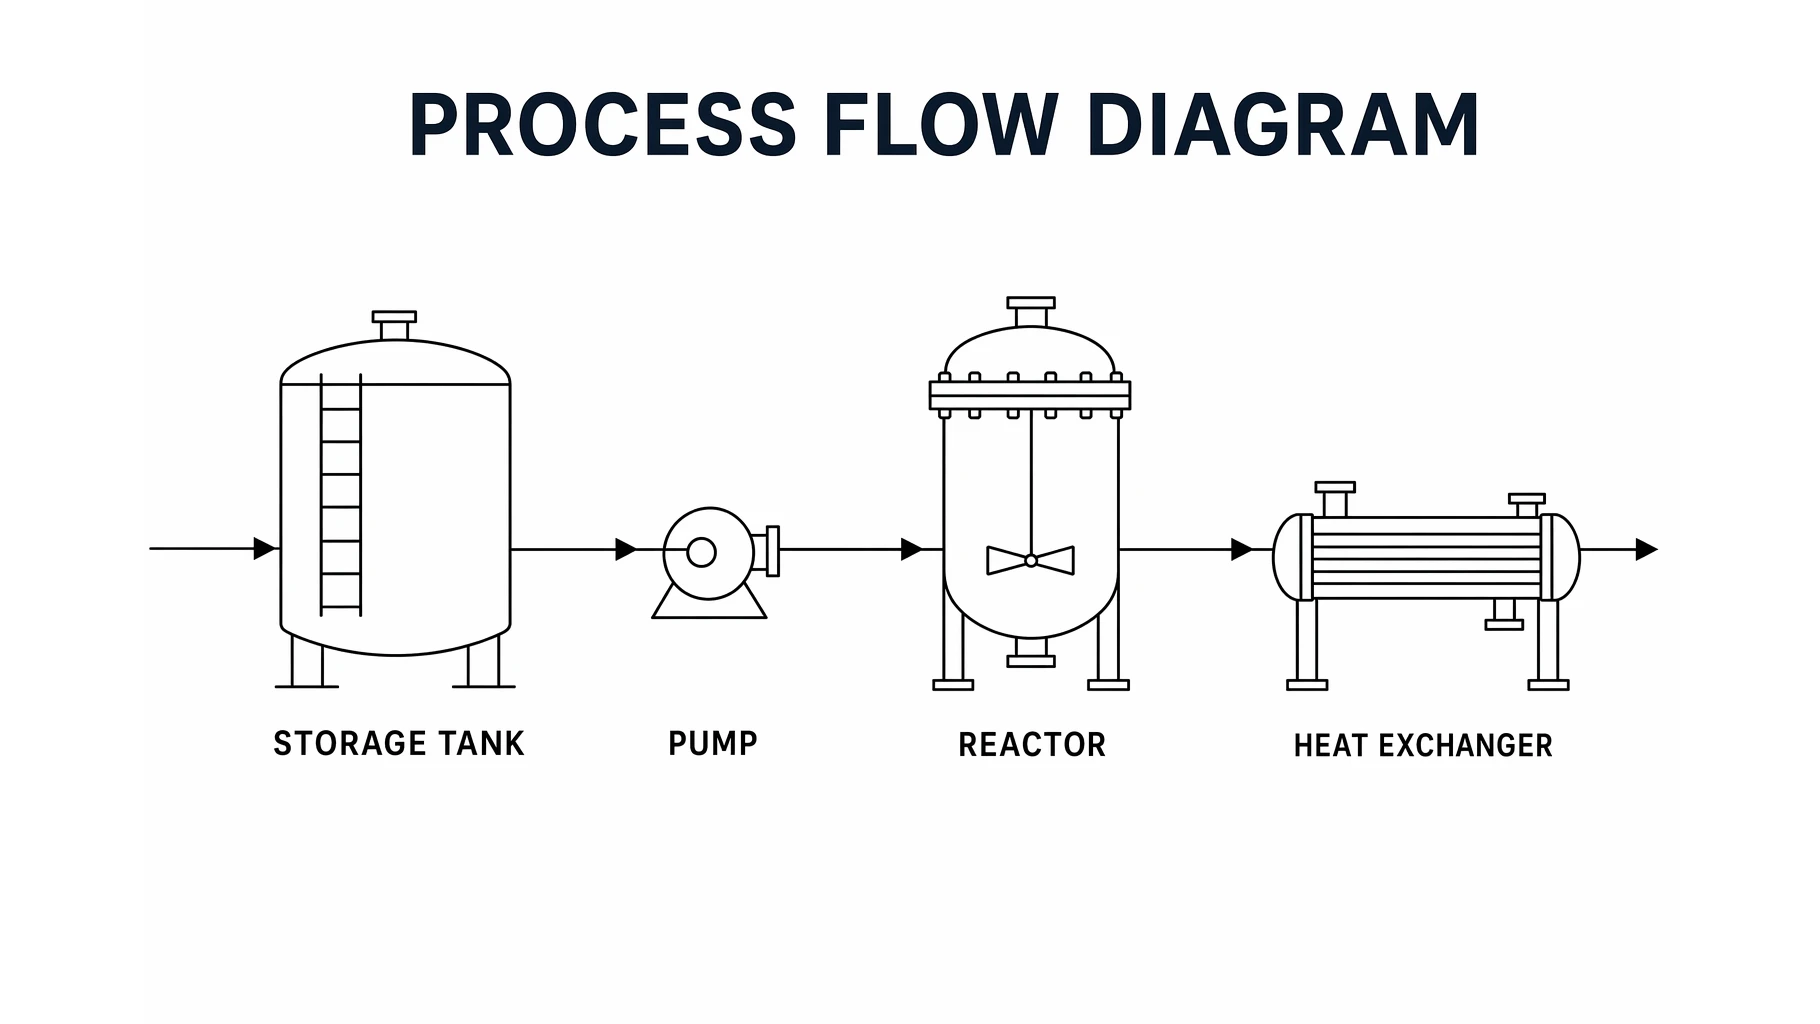
Process Flow Diagram: Symbols, Examples & How to Read
Learn what a process flow diagram (PFD) is, the equipment symbols and streams it uses, how to read one, and how a PFD differs from a P&ID and a flowchart.
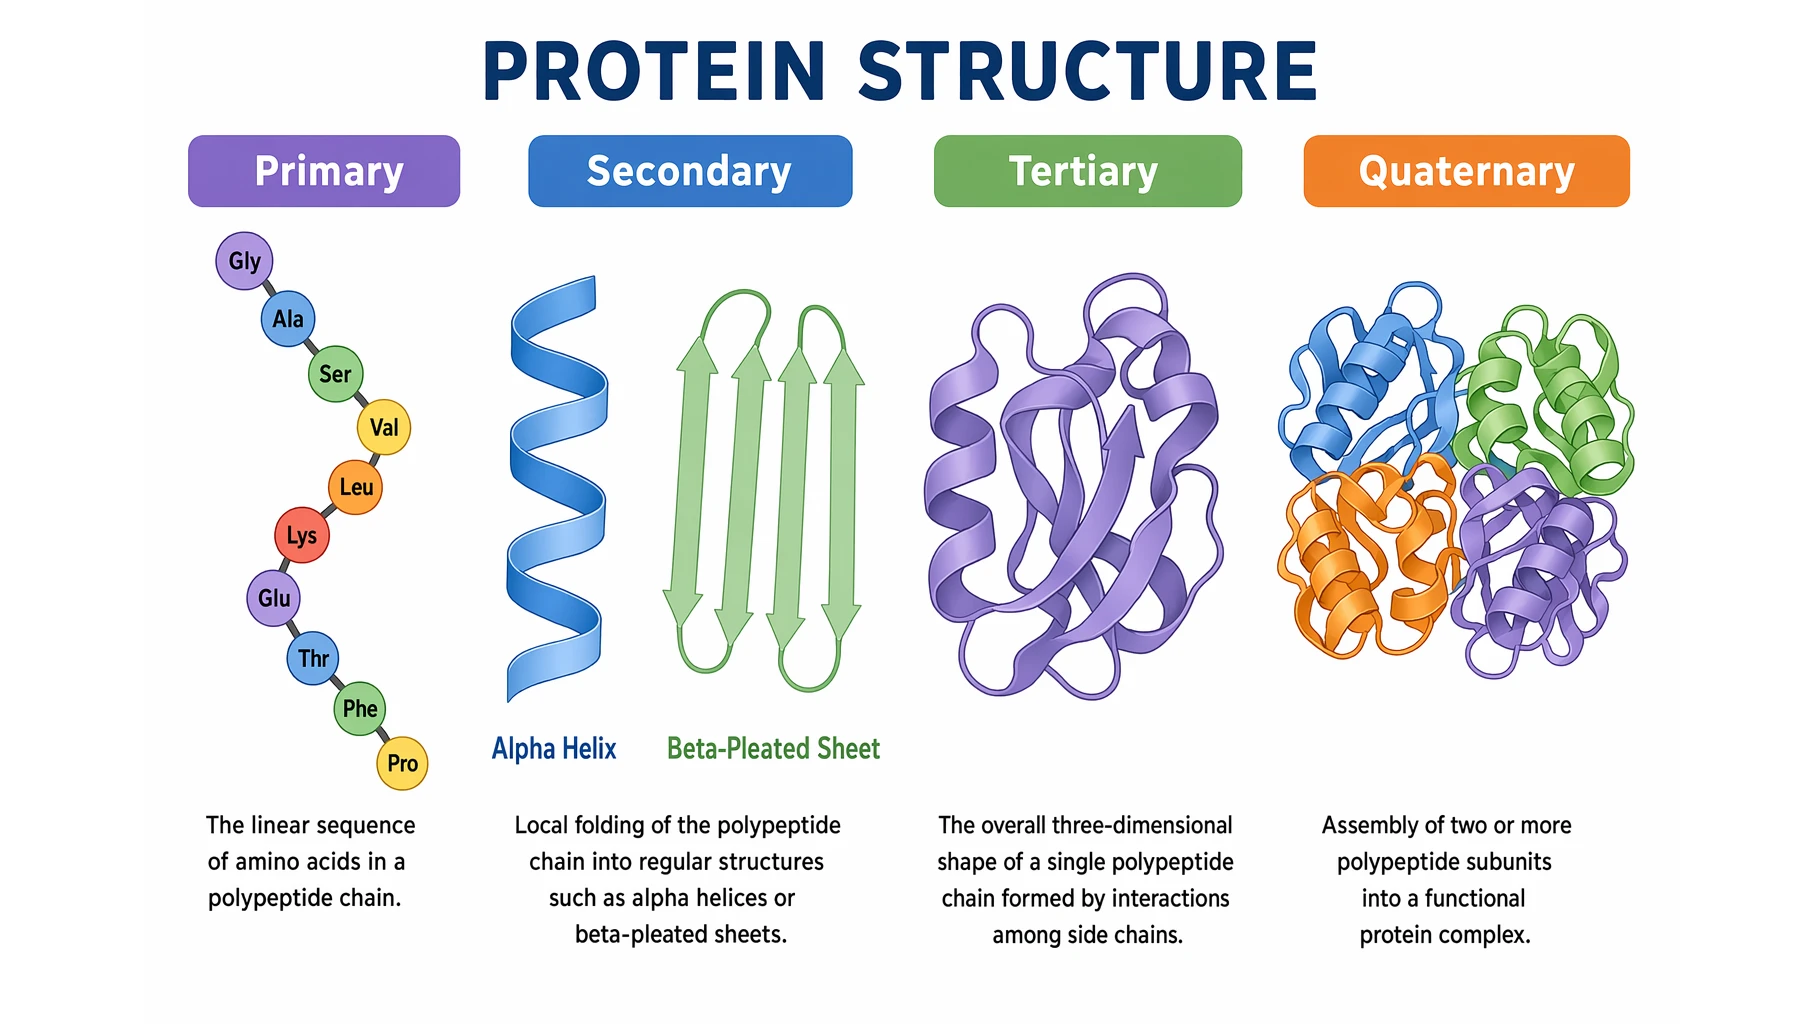
Protein Structure: The 4 Levels Explained Simply
Protein structure made simple: the four levels (primary, secondary, tertiary, quaternary), the bonds that stabilize each, and why structure decides function.
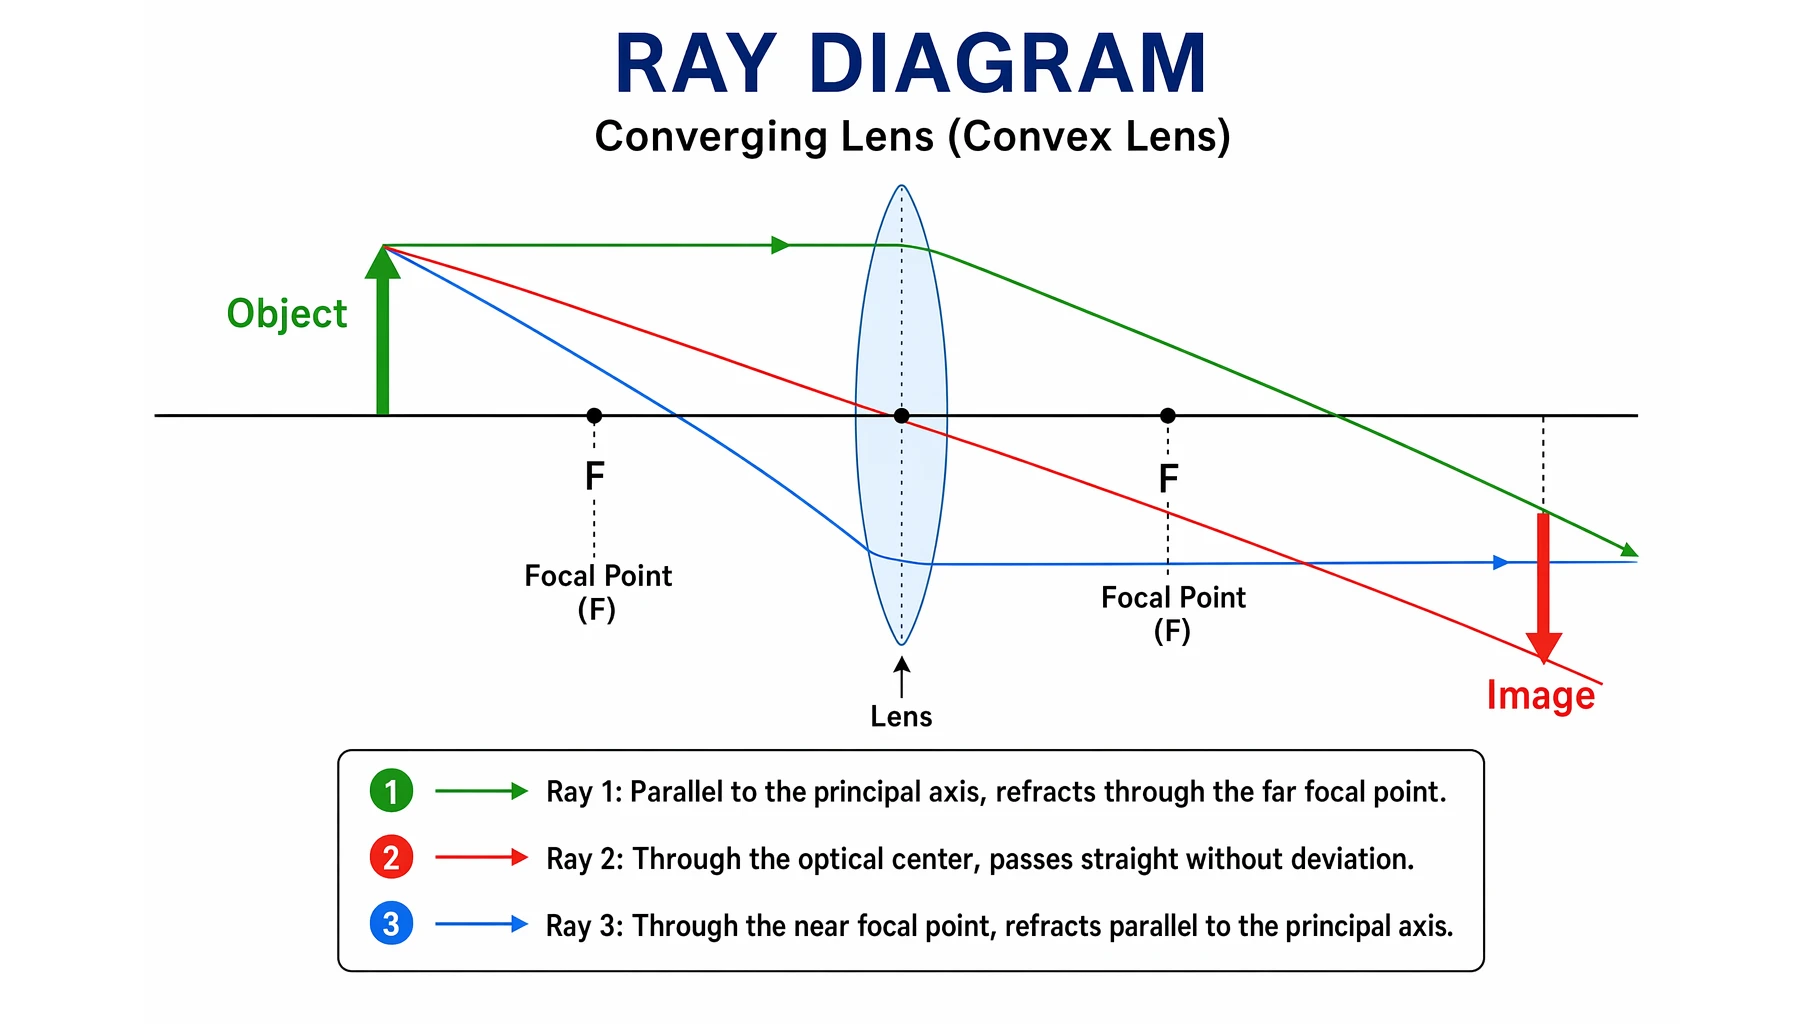
Ray Diagram: Lenses and Mirrors Explained
Learn what a ray diagram is, the principal ray rules for lenses and mirrors, real versus virtual images, and how to draw one step by step with clear examples.
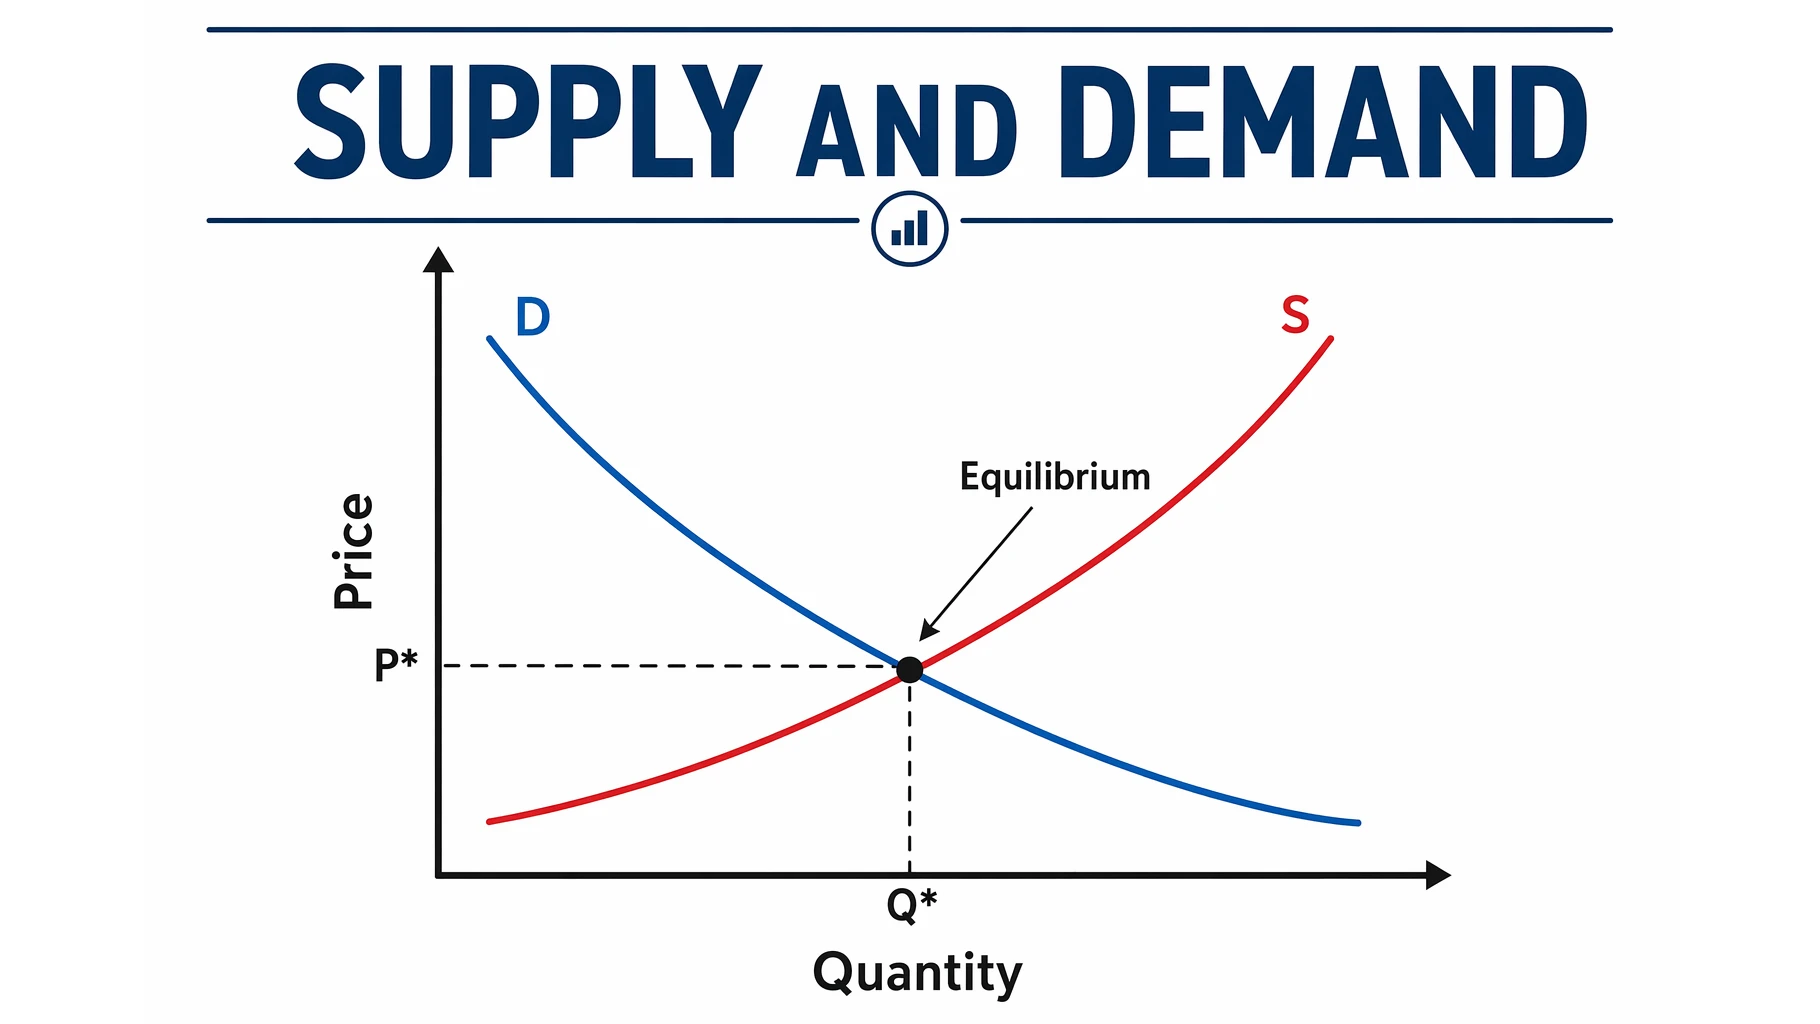
Supply and Demand Graph: Equilibrium & Shifts
Learn how to read the supply and demand graph: why demand slopes down and supply slopes up, where they meet at equilibrium, plus shifts, surplus, and shortage.