
Process Flow Diagram: Symbols, Examples & How to Read
Learn what a process flow diagram (PFD) is, the equipment symbols and streams it uses, how to read one, and how a PFD differs from a P&ID and a flowchart.
A process flow diagram is the engineer's bird's-eye view of a plant. Instead of tracking every valve and instrument, it shows the major equipment and the streams of material and energy moving between them — the big picture of how raw feed becomes finished product.
This guide explains what a process flow diagram (PFD) is, the symbols and streams it uses, how to read one, and how it differs from a P&ID and an ordinary flowchart.
Quick Answer: What Is a Process Flow Diagram?
A process flow diagram (PFD) is a high-level schematic used in chemical and process engineering that shows the major equipment in a process and the material and energy streams that connect them. It captures what the process does — the flow path and key operating conditions — without the piping, valves, and instrumentation detail of a P&ID.
What a PFD Shows
A PFD answers one question: how does feed turn into product? To do that it shows three things.
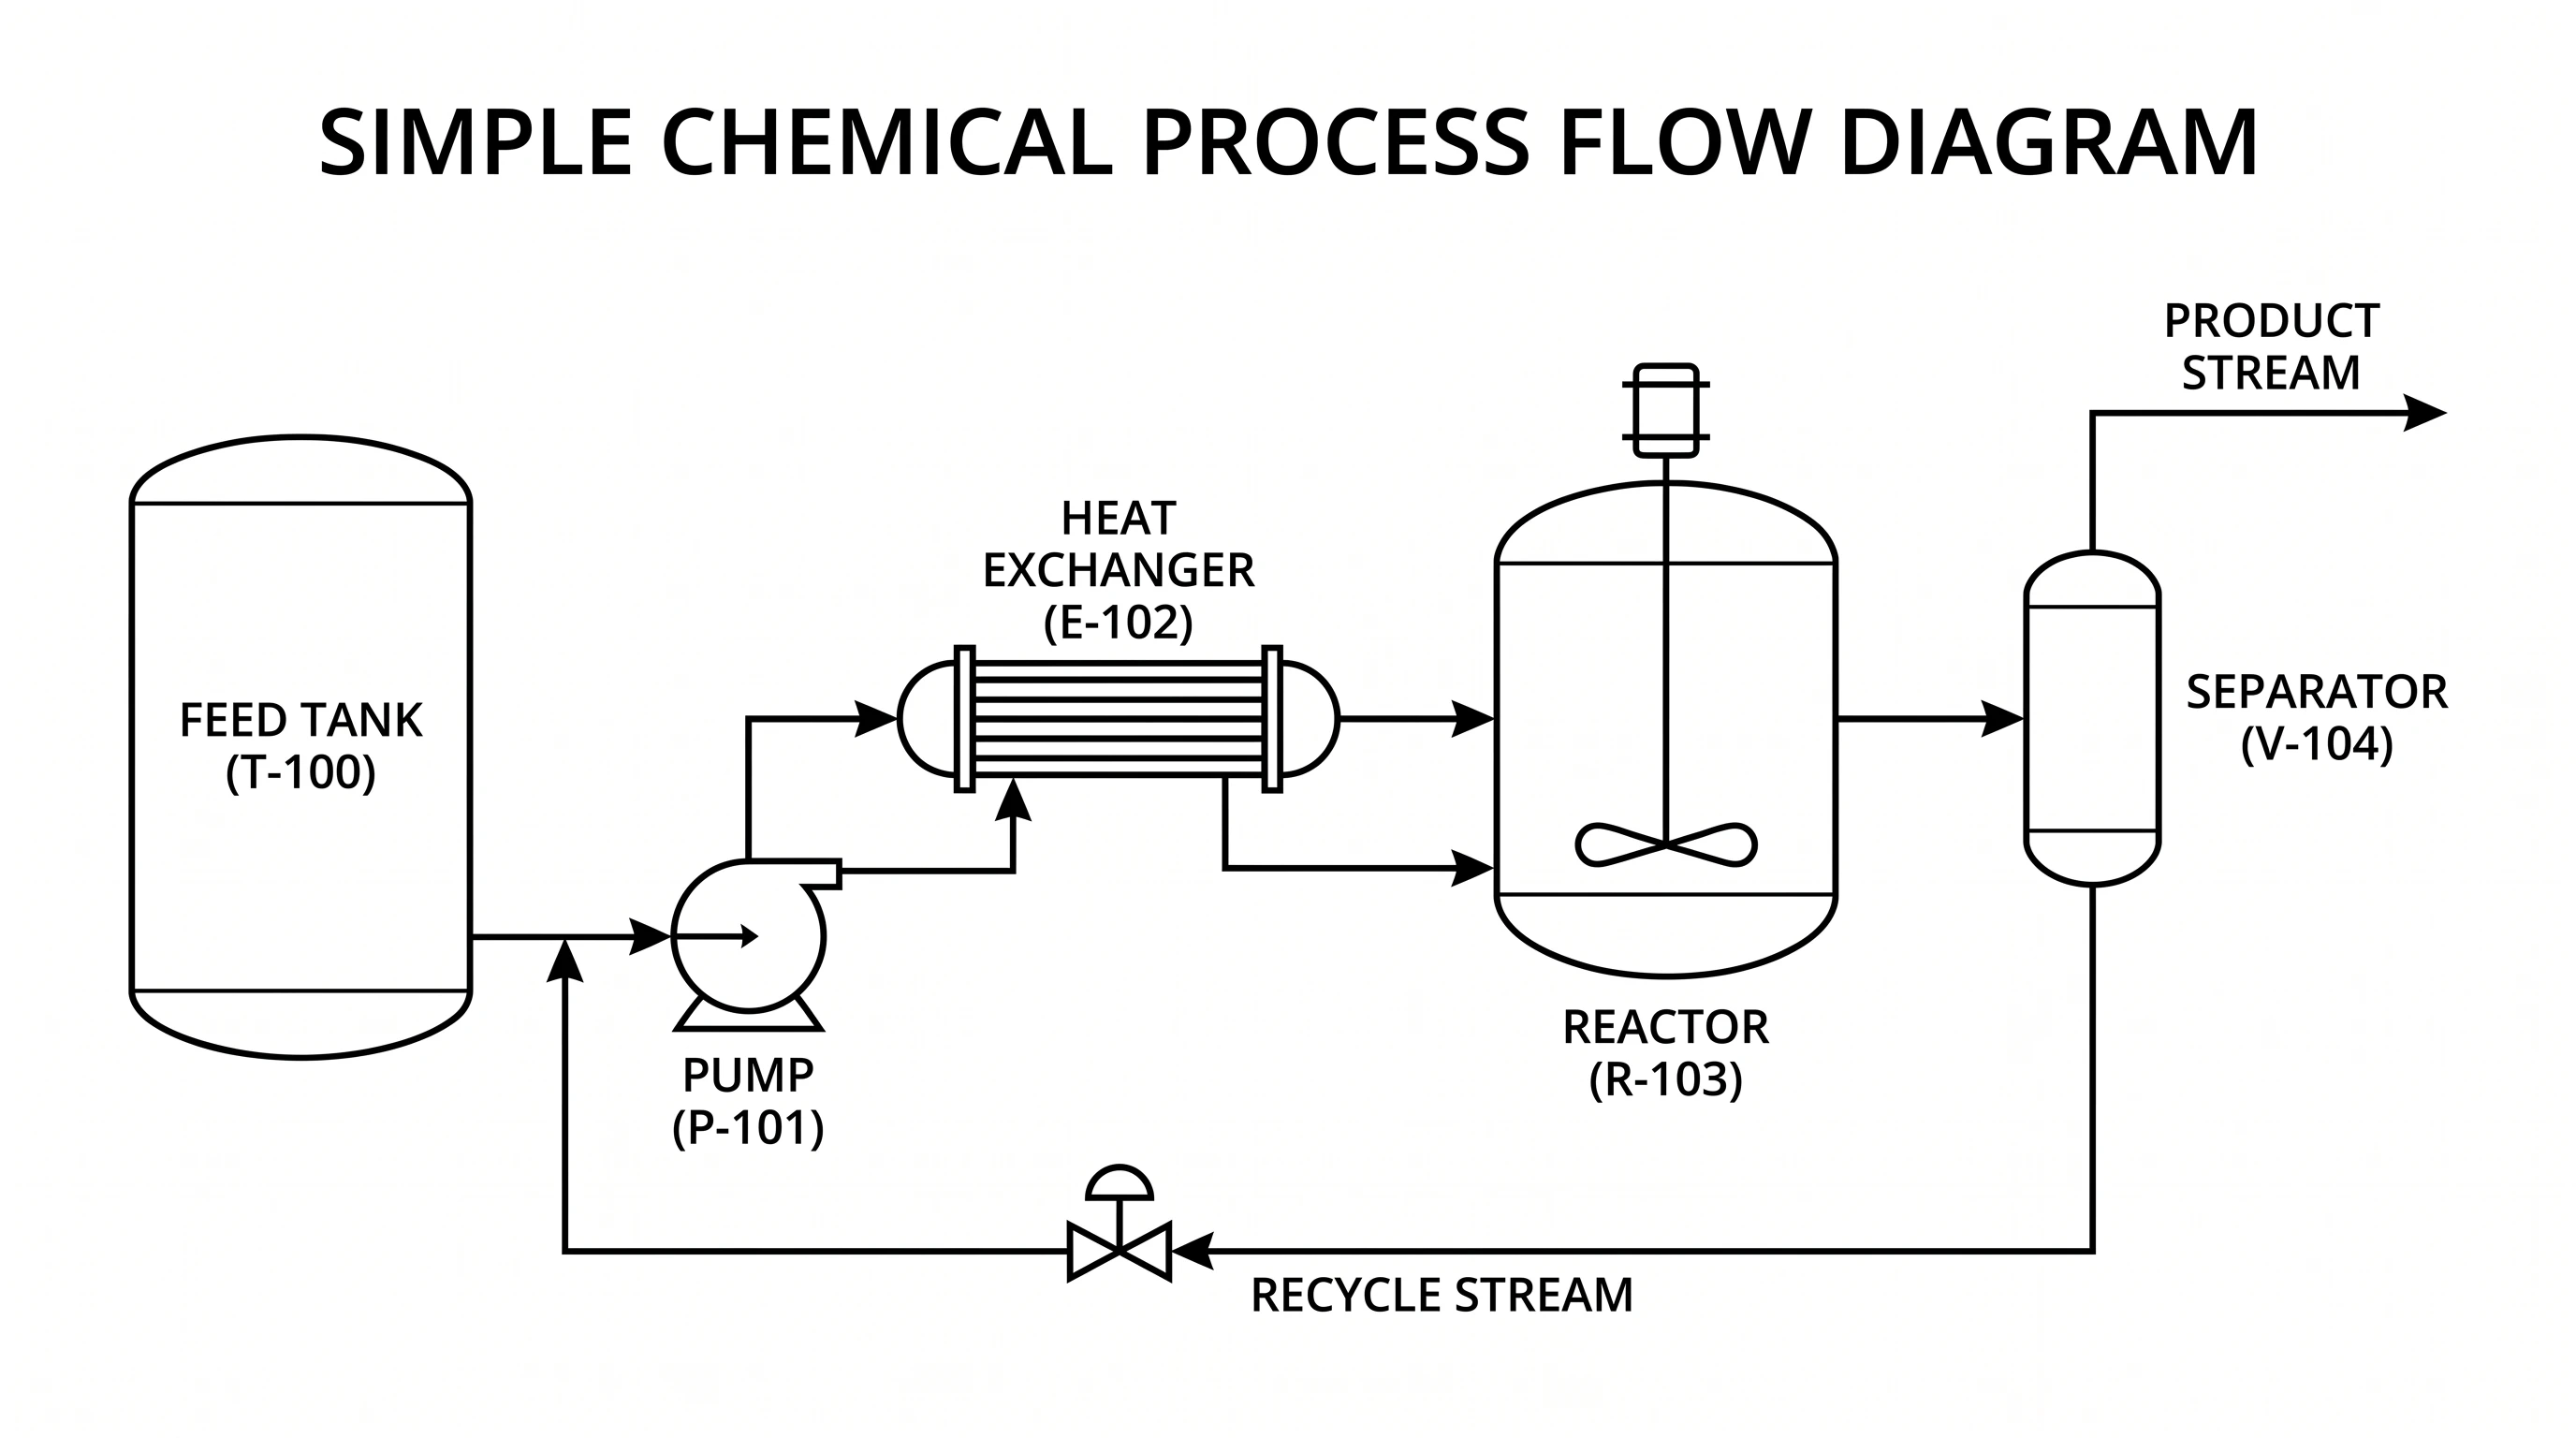
- Major equipment — tanks, pumps, compressors, reactors, distillation columns, heat exchangers, and separators. Minor items like individual valves are left out.
- Process streams — every line is a stream of material (or energy) moving between equipment. Arrows show direction; recycle loops are drawn explicitly.
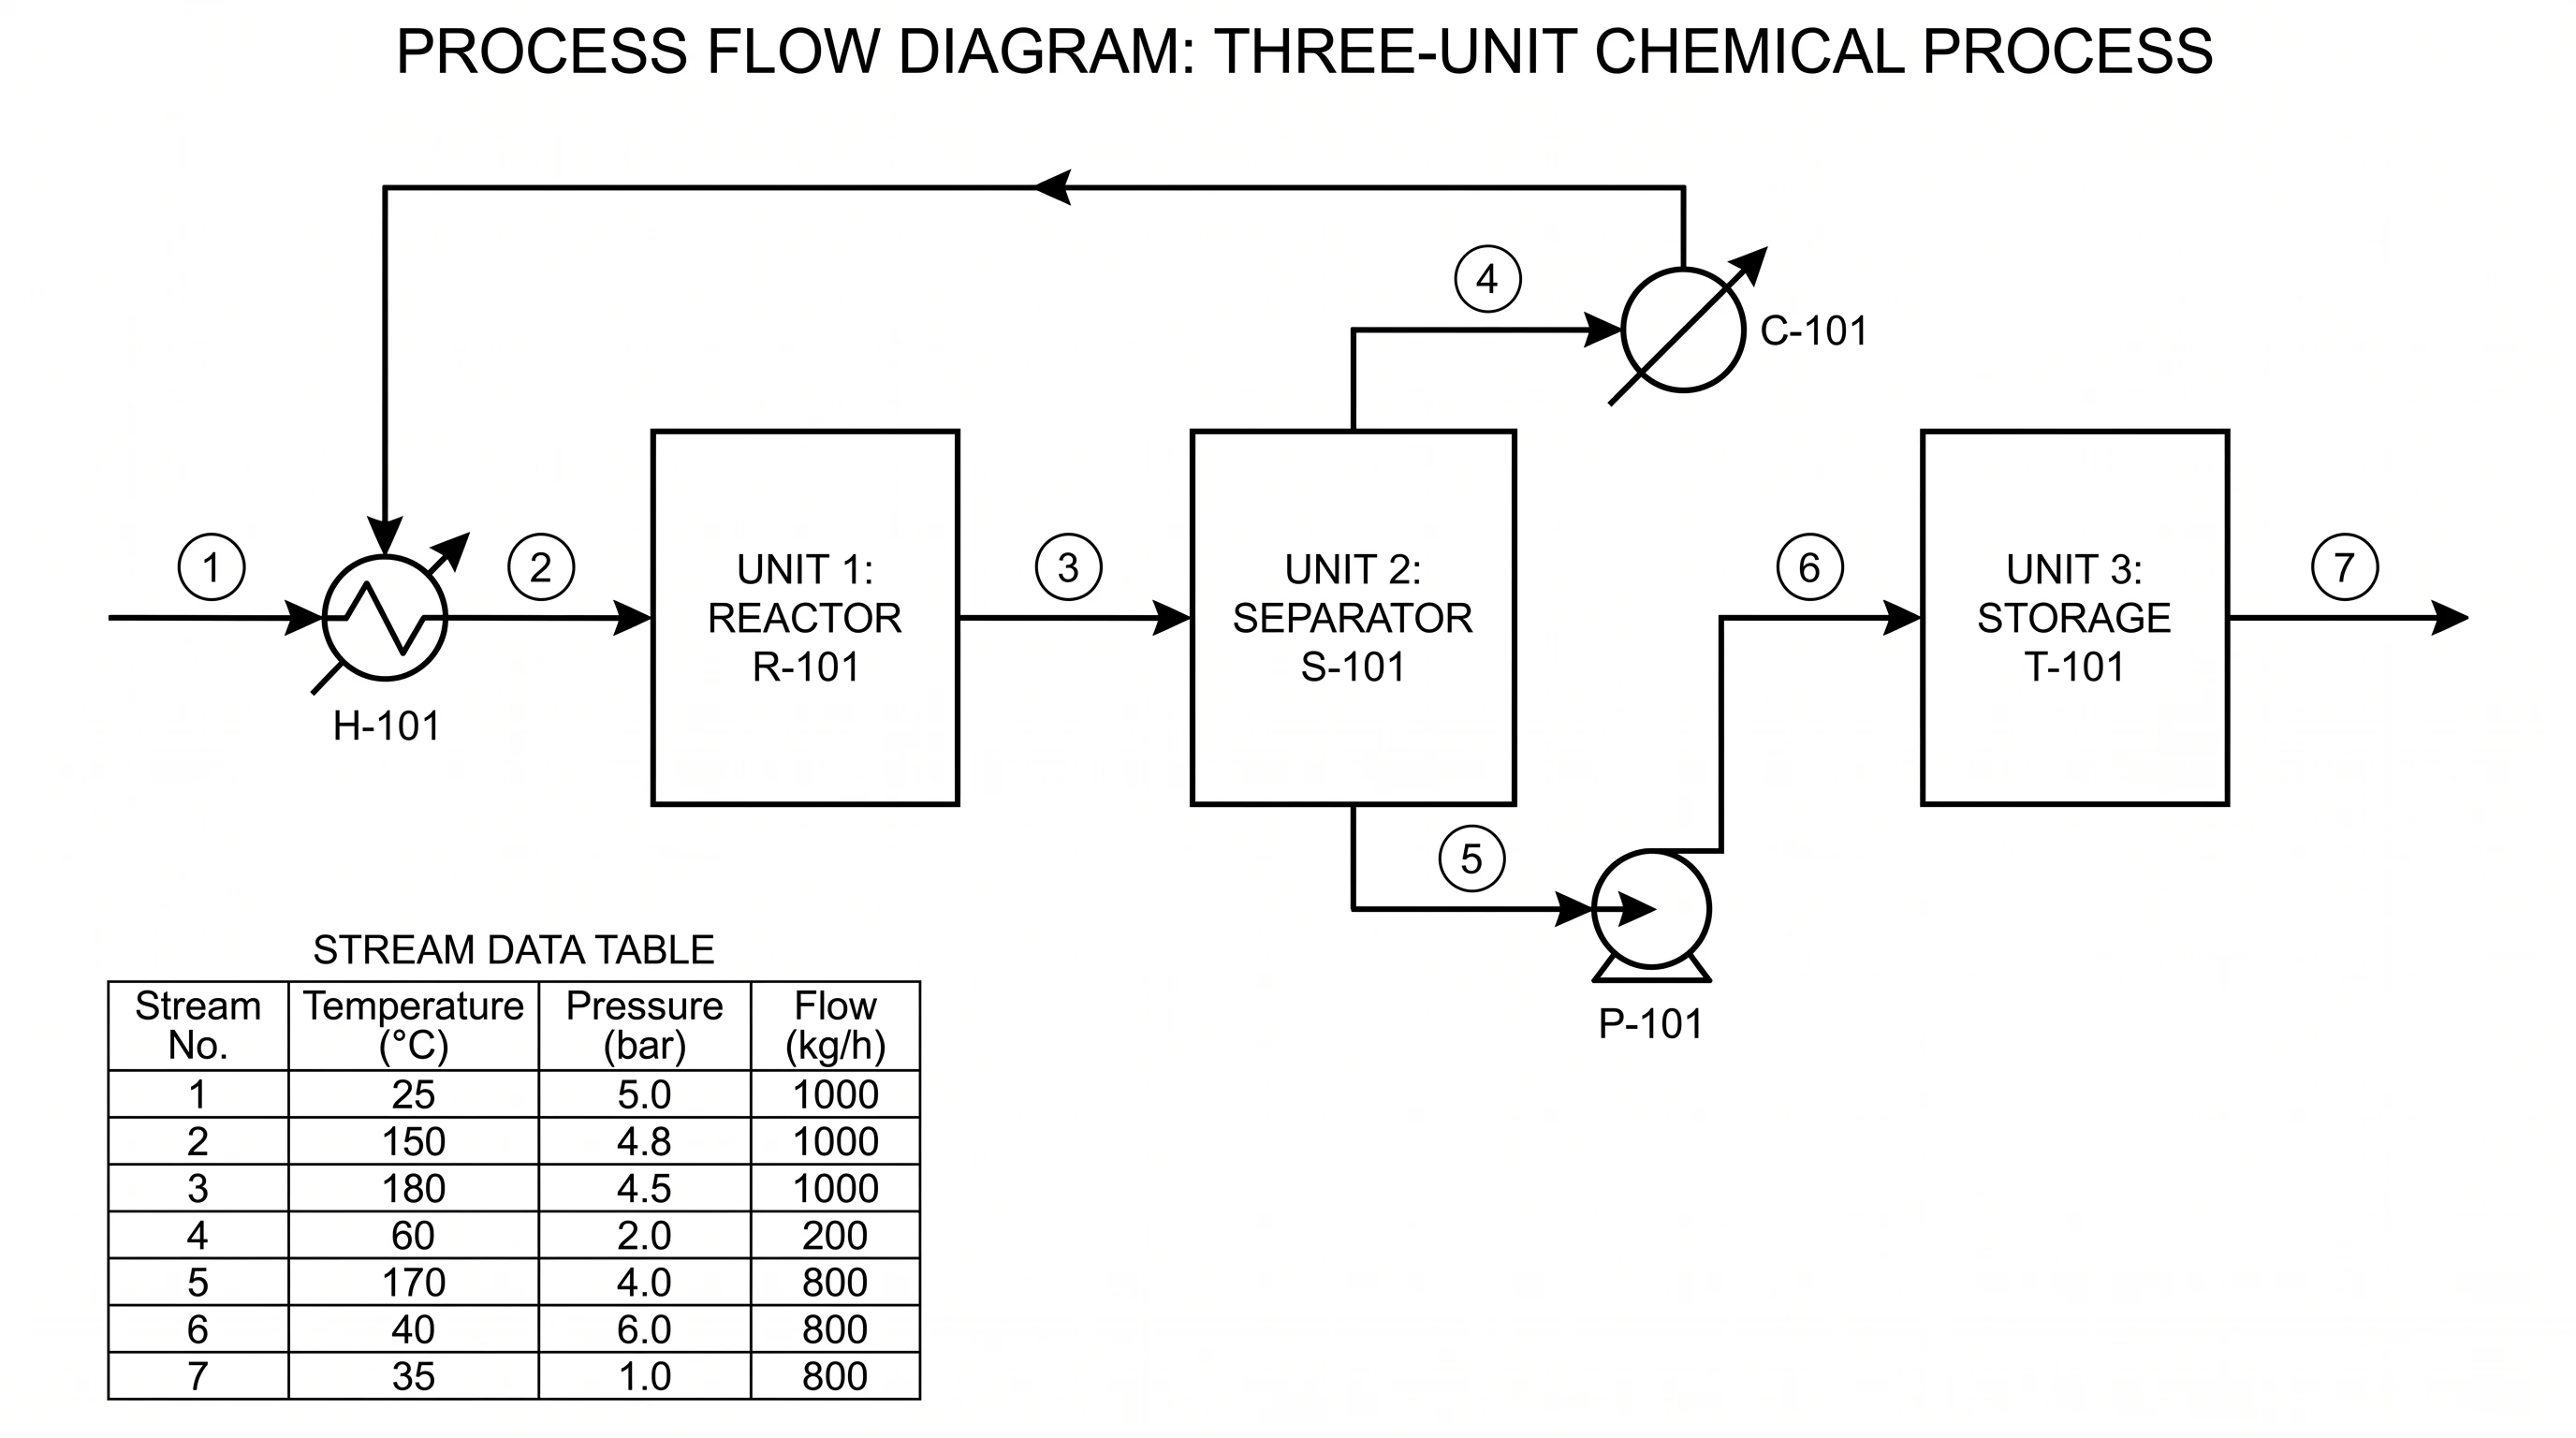
- Operating data — streams are often numbered and tied to a stream table listing temperature, pressure, and flow rate. This is the heart of the heat-and-material balance.
Process Flow Diagram Generator
Describe a process and get a clean, labeled PFD with standard equipment symbols and material-flow streams — download it free as SVG or PNG.
Make a process flow diagram ->PFD Symbols and Elements
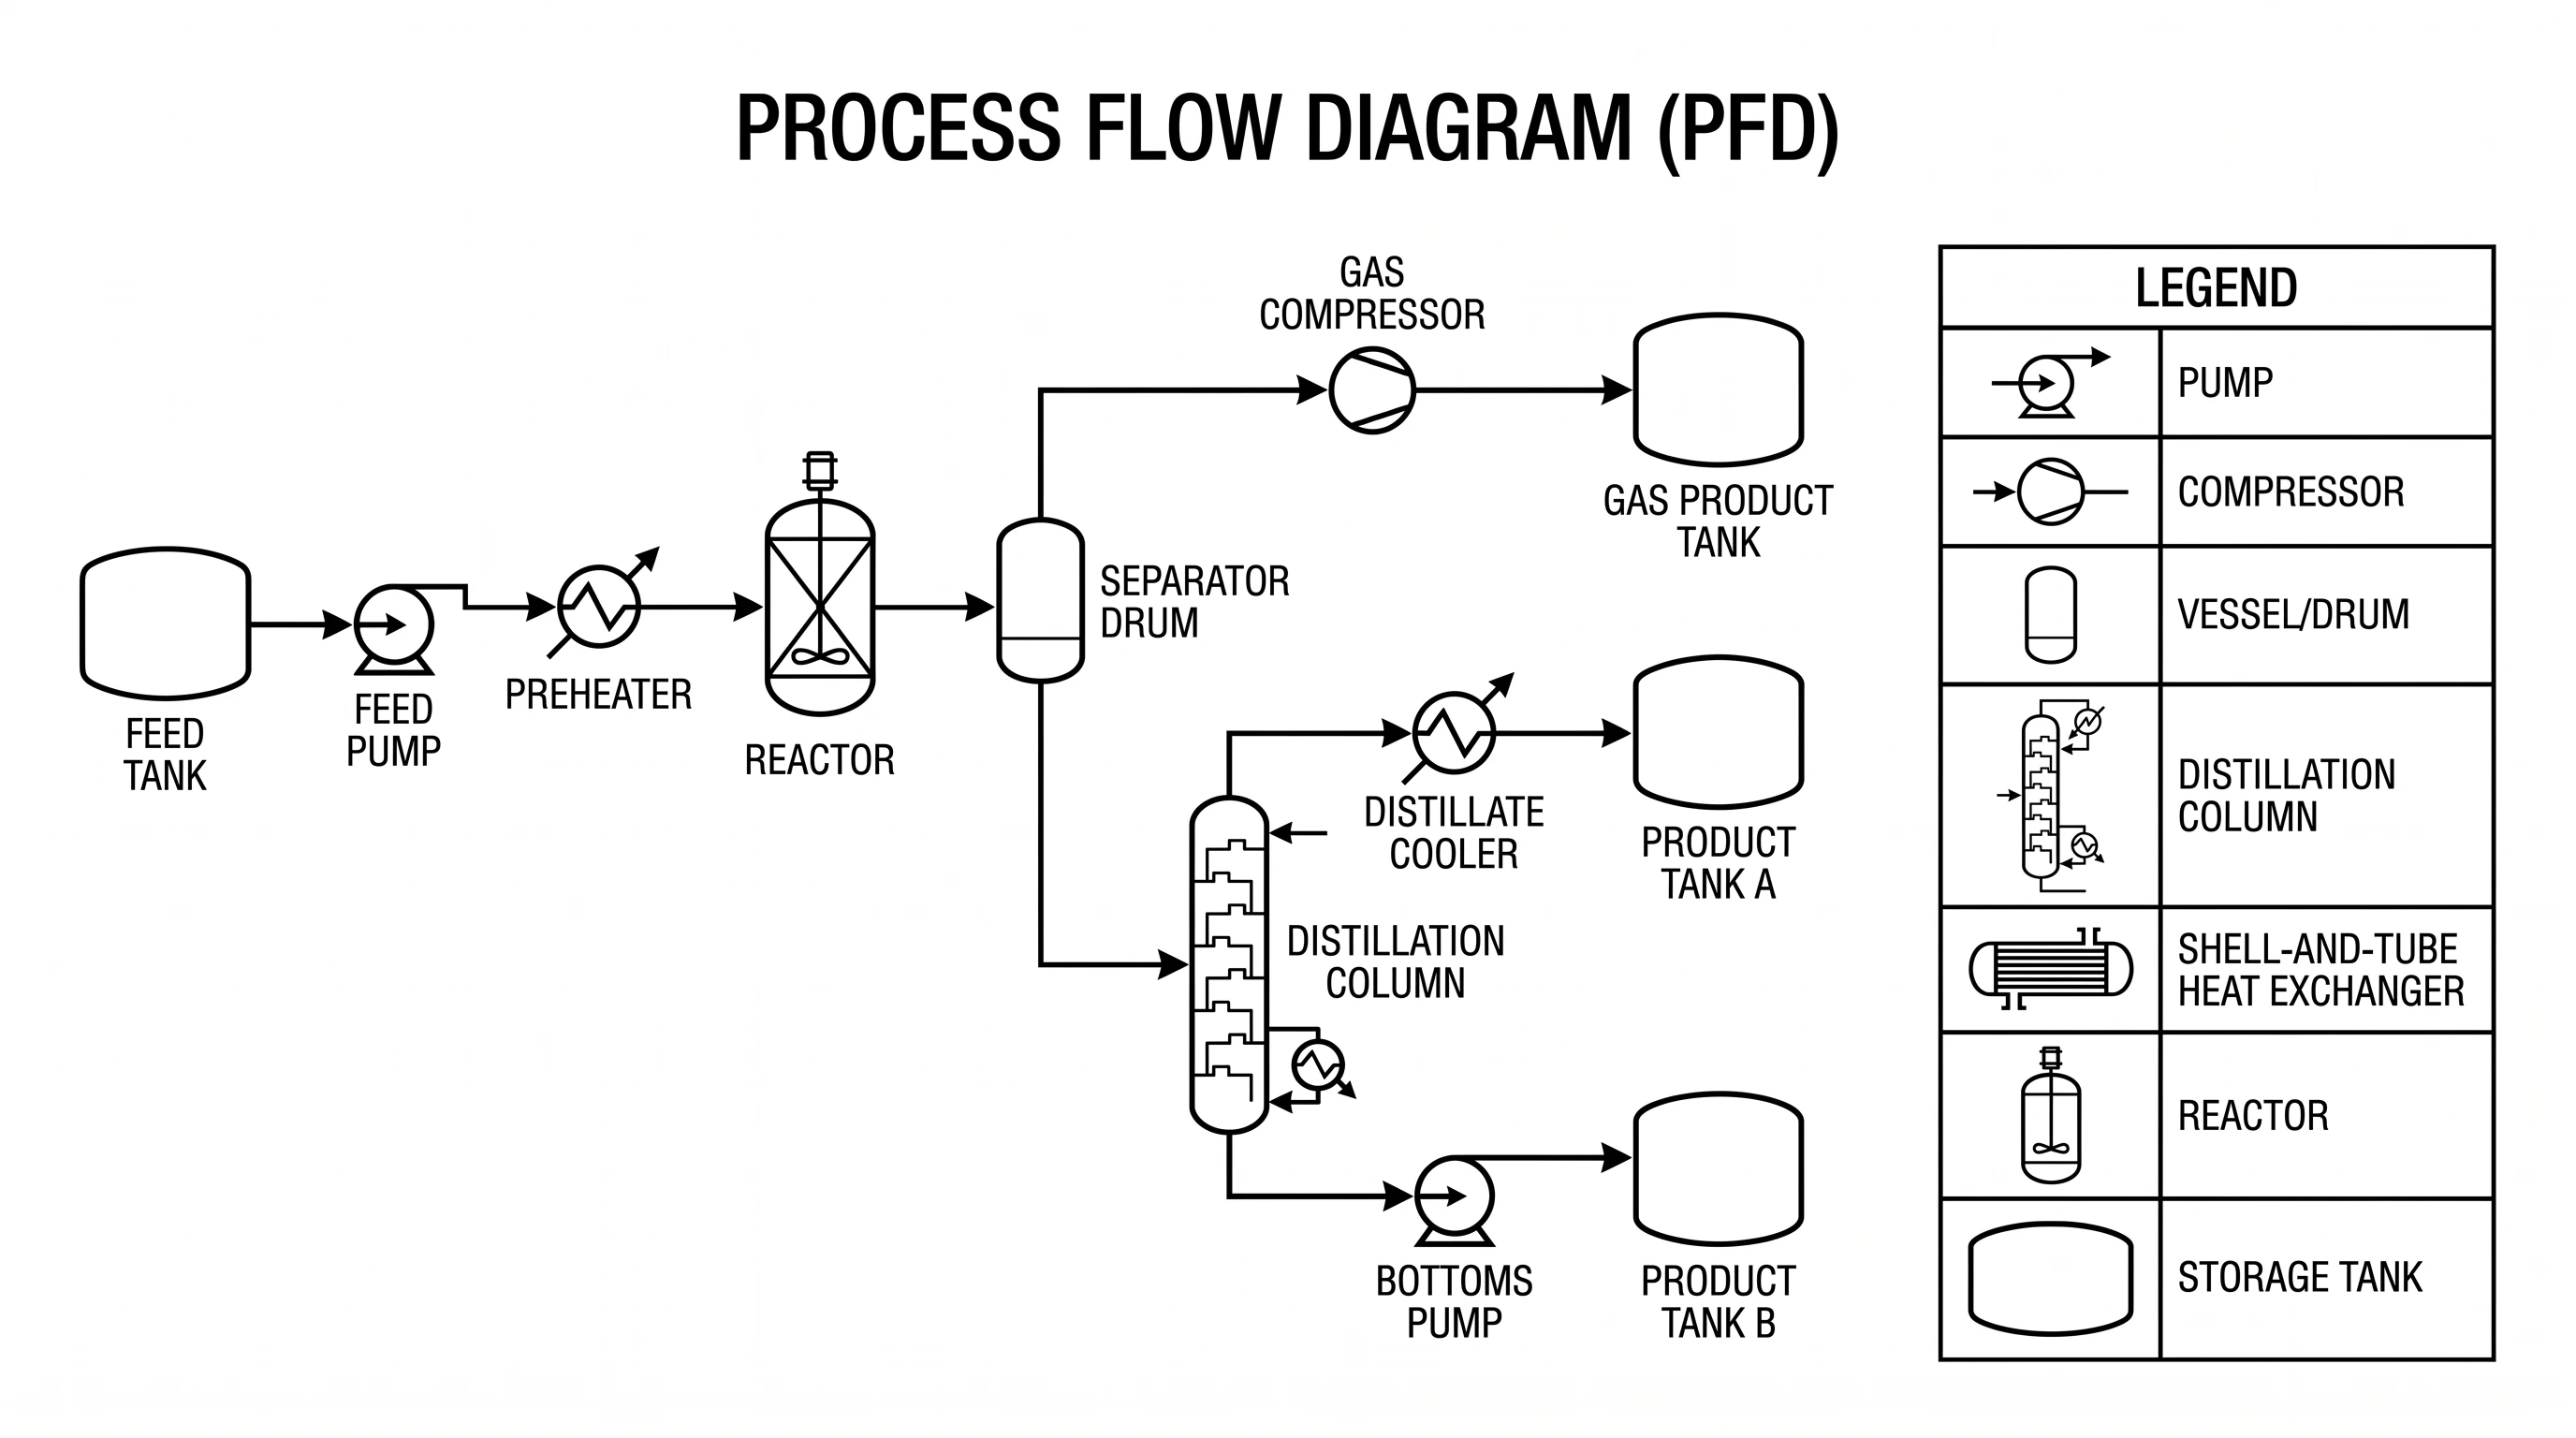
PFD symbols are standardized so that everyone reads a diagram the same way, following conventions from bodies like ISA and ISO. The most common equipment symbols are:
- Vessels and tanks — vertical or horizontal cylinders, used for storage, surge, and separation.
- Pumps — a circle with a flow indicator; compressors are drawn as trapezoids or fan shapes.
- Heat exchangers — a circle or rectangle with internal tube lines, showing where streams are heated or cooled.
- Reactors — a vessel with internals (an agitator, packing, or catalyst bed).
- Distillation columns — tall vertical towers with internal trays or packing.
- Stream lines and arrows — solid lines carry material; arrowheads set the direction; tags (like T-100 or P-101) identify each unit.
How to Read a Process Flow Diagram
Reading a PFD is a core engineering skill, and it follows a simple path:
- Find the feed. Locate the incoming raw-material stream — usually on the left.
- Follow the arrows. Trace the line from one piece of equipment to the next, in the direction the arrowheads point.
- Name each operation. At every unit, ask what it does: pumping, heating, reacting, separating.
- Watch for recycle loops. A stream that loops back upstream returns unreacted material — a hallmark of efficient process design.
- Read the stream table. Match each numbered stream to its row of temperature, pressure, and flow to understand the conditions.
PFD vs P&ID vs Flowchart
These three diagrams are easy to confuse but serve different audiences:
- PFD (process flow diagram) — a high-level overview. Major equipment and main streams only, with key operating conditions. Used for design reviews, training, and communicating the process at a glance.
- P&ID (piping and instrumentation diagram) — a detailed engineering drawing. It adds every pipe, valve, instrument, and control loop on top of the equipment. Used by technicians, instrumentation engineers, and for construction and safety work.
- Flowchart — a generic process-step diagram. It uses boxes for steps and diamonds for decisions, and is used for software, business workflows, and decision logic rather than physical plant equipment.
A useful rule of thumb: a PFD tells you what the process does, a P&ID tells you how it is built and controlled, and a flowchart tells you what happens next in a sequence of decisions.
How to Make a PFD
- List the major equipment the process needs, in order from feed to product.
- Lay them out left to right so material flows naturally across the page.
- Connect them with stream lines and add arrowheads for direction; draw any recycle loops back upstream.
- Tag everything — give each unit an identifier and number each stream.
- Add a stream table with temperature, pressure, and flow for each numbered stream.
You can draft this by hand, but a generator turns a plain-text description into a clean, labeled diagram in seconds. Try the process flow diagram generator and refine from there.
Common Mistakes
- Adding too much detail. Valves and instruments belong on a P&ID, not a PFD. Keep it to major equipment.
- Missing the recycle loop. Forgetting to draw recycled streams hides where unreacted material goes.
- Unlabeled streams. Without numbers and a stream table, the diagram can't communicate operating conditions.
- Inconsistent flow direction. Lay the process out so material generally moves one way; mixing directions confuses readers.
FAQ
What is a process flow diagram (PFD)?
A PFD is a high-level schematic that shows the major equipment in a chemical or process plant and the material and energy streams connecting them, along with key operating conditions like temperature, pressure, and flow.
What symbols are used in a PFD?
PFDs use standardized symbols for equipment — cylinders for tanks and vessels, circles for pumps, tube symbols for heat exchangers, vessels with internals for reactors, and tall towers for distillation columns — plus lines with arrowheads for streams.
What is the difference between a PFD and a P&ID?
A PFD is a high-level overview showing only major equipment and main streams, while a P&ID is a detailed drawing that adds every pipe, valve, instrument, and control loop. The PFD shows what the process does; the P&ID shows how it is built and controlled.
Is a process flow diagram the same as a flowchart?
No. A flowchart uses boxes and decision diamonds to map a sequence of steps or decisions, often for software or business workflows. A PFD specifically maps physical plant equipment and material streams in a process.
How do you read a process flow diagram?
Start at the feed stream, follow the arrows from one piece of equipment to the next, identify what each unit does, watch for recycle loops, and use the stream table to read the temperature, pressure, and flow of each numbered stream.
Process Flow Diagram Generator
Turn a plain-text process description into a clean, labeled PFD you can download free.
Further Reading
Catégories
Plus d'articles

Column Chart Maker Guide: When to Use Column Charts and How to Make One
Learn when to use a column chart, how it differs from a bar chart, and how to make clean grouped, stacked, and spreadsheet-ready column charts.

How to Draw a Neural Network Architecture Diagram: A Complete Guide
Learn how to draw neural network architecture diagrams for CNNs, RNNs, Transformers, and more. Step-by-step guide with tools, examples, and best practices for researchers and engineers.

How to Abstractly Depict People in Research Videos: Complete Guide for Scientists
Learn effective techniques for representing people abstractly in scientific videos and animations. Includes design approaches, privacy considerations, and practical examples for research communication.