Motion Diagram Physics Maker with Position Dots
Create physics motion diagrams with position dots, velocity arrows, acceleration arrows, equal time intervals, and SVG, PNG, or CSV export.
Motion settings
Use equally spaced time snapshots.
Diagram preview
x(t) = x₀ + v₀t + 1/2 at², v(t) = v₀ + at
Dots
6
Start x
0 m
Initial v
0.8 m/s
Acceleration
0.7 m/s²
Motion Diagram Examples
Compare six common classroom cases: constant speed, acceleration, deceleration, leftward motion, vertical throw, and free fall.
Constant Speed
v₀ = 2 m/s, a = 0 m/s²
Speeding Up
v₀ = 0.8 m/s, a = 0.7 m/s²
Slowing Down
v₀ = 4 m/s, a = -0.55 m/s²
Thrown Upward
v₀ = 4.8 m/s, a = -1.2 m/s²
Moving Left
v₀ = -2 m/s, a = 0 m/s²
Dropped Object
v₀ = 0 m/s, a = -1.4 m/s²
What is a motion diagram physics maker?
A motion diagram physics maker builds a visual model of an object at equal time intervals. Each dot marks position at one snapshot in time. Dot spacing shows relative speed, velocity arrows show direction and speed, and the acceleration arrow shows how velocity changes.
Why this tool uses precise SVG rendering
- Motion diagrams are physics models, so dot spacing and arrow direction should follow the motion values exactly.
- The tool calculates position with x(t) = x0 + v0t + 1/2 at^2 and velocity with v(t) = v0 + at.
- It renders a clean SVG in the browser instead of using an AI image model, so the same inputs always produce the same diagram.
- SVG, PNG, and CSV export make the result useful for worksheets, slides, homework explanations, and lab notes.
What can you adjust?
- Initial position, initial velocity, acceleration, time interval, and number of dots.
- Presets for constant speed, speeding up, slowing down, moving left, and vertical throw examples.
- Velocity arrows, acceleration arrow, and time labels can be shown or hidden.
- CSV export includes every time, position, velocity, and acceleration value.
Motion diagram vs free body diagram
A motion diagram describes kinematics: where the object is, which way it moves, and whether velocity changes. A free body diagram describes dynamics: the forces acting on the object. They are connected, but they are not the same diagram.
When to use this tool
- Explaining constant speed, speeding up, and slowing down motion.
- Building classroom worksheets about position dots, velocity arrows, and acceleration direction.
- Checking whether a written motion description matches a diagram.
- Creating clean physics visuals without spending image-generation credits.
Preguntas frecuentes
Related Physics Tools
 Physics
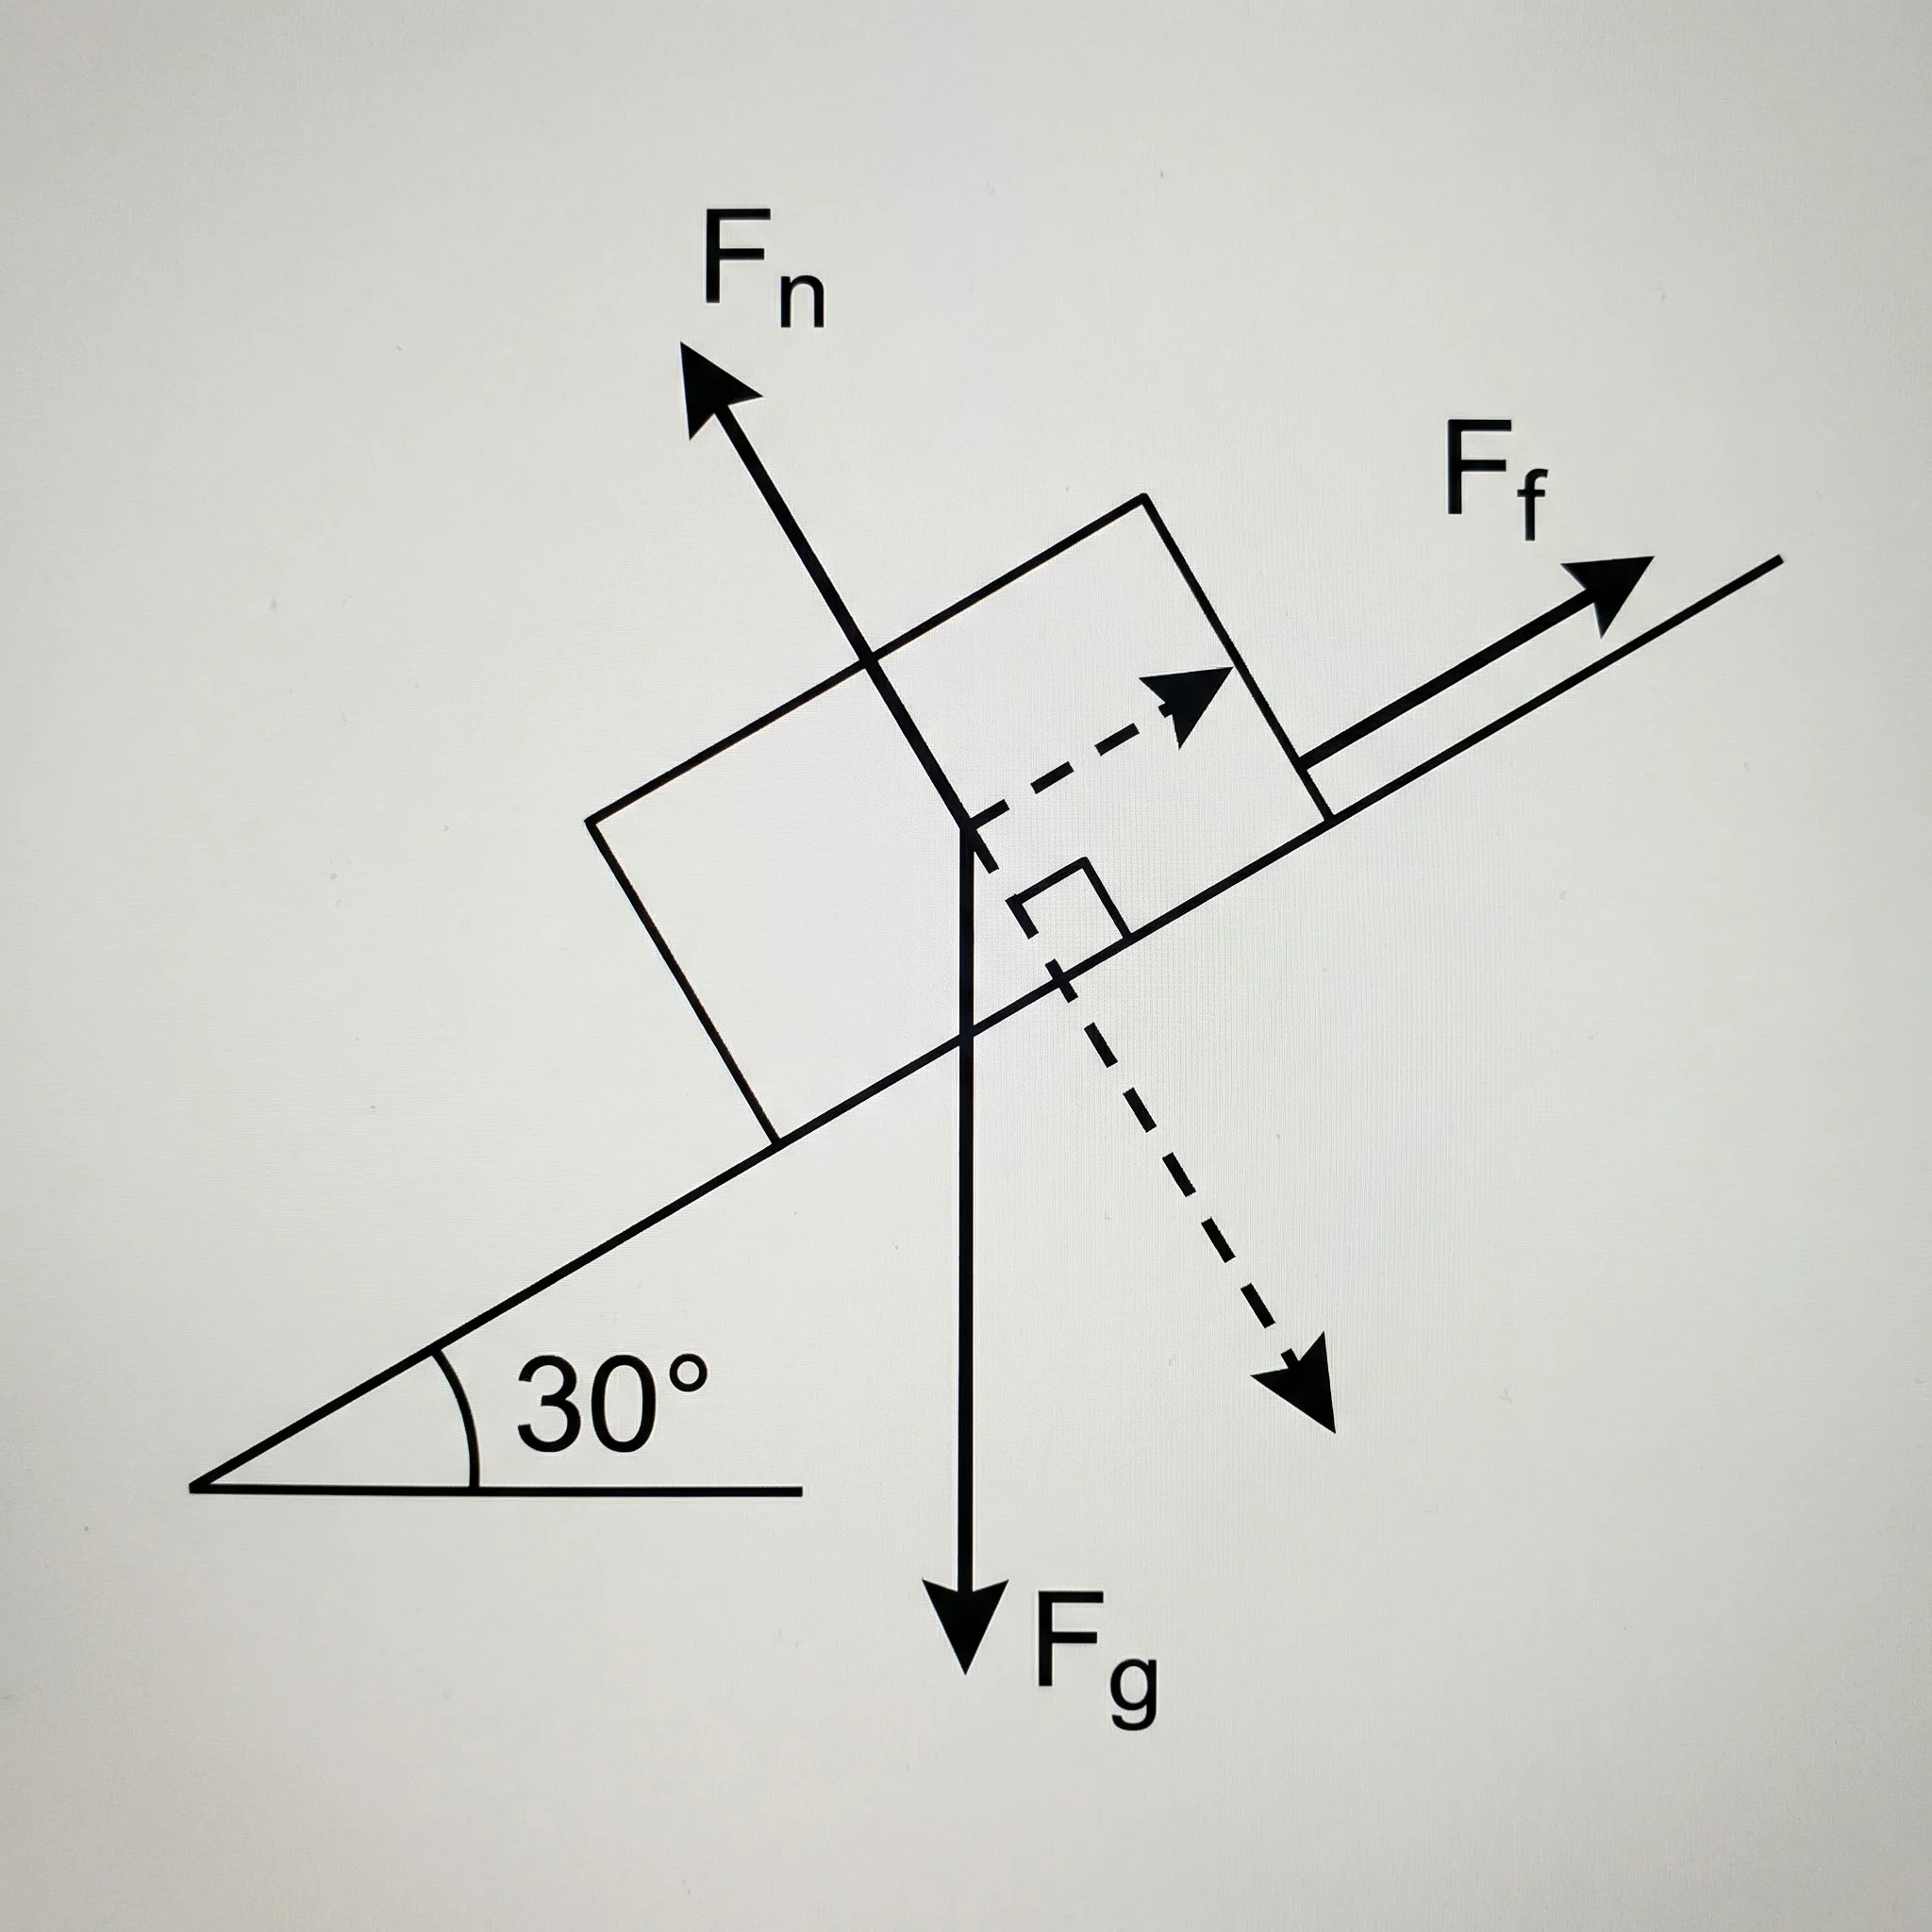
Free Body Diagram Generator
Create force diagrams with labeled weight, normal force, friction, tension, and applied force vectors.
 Physics
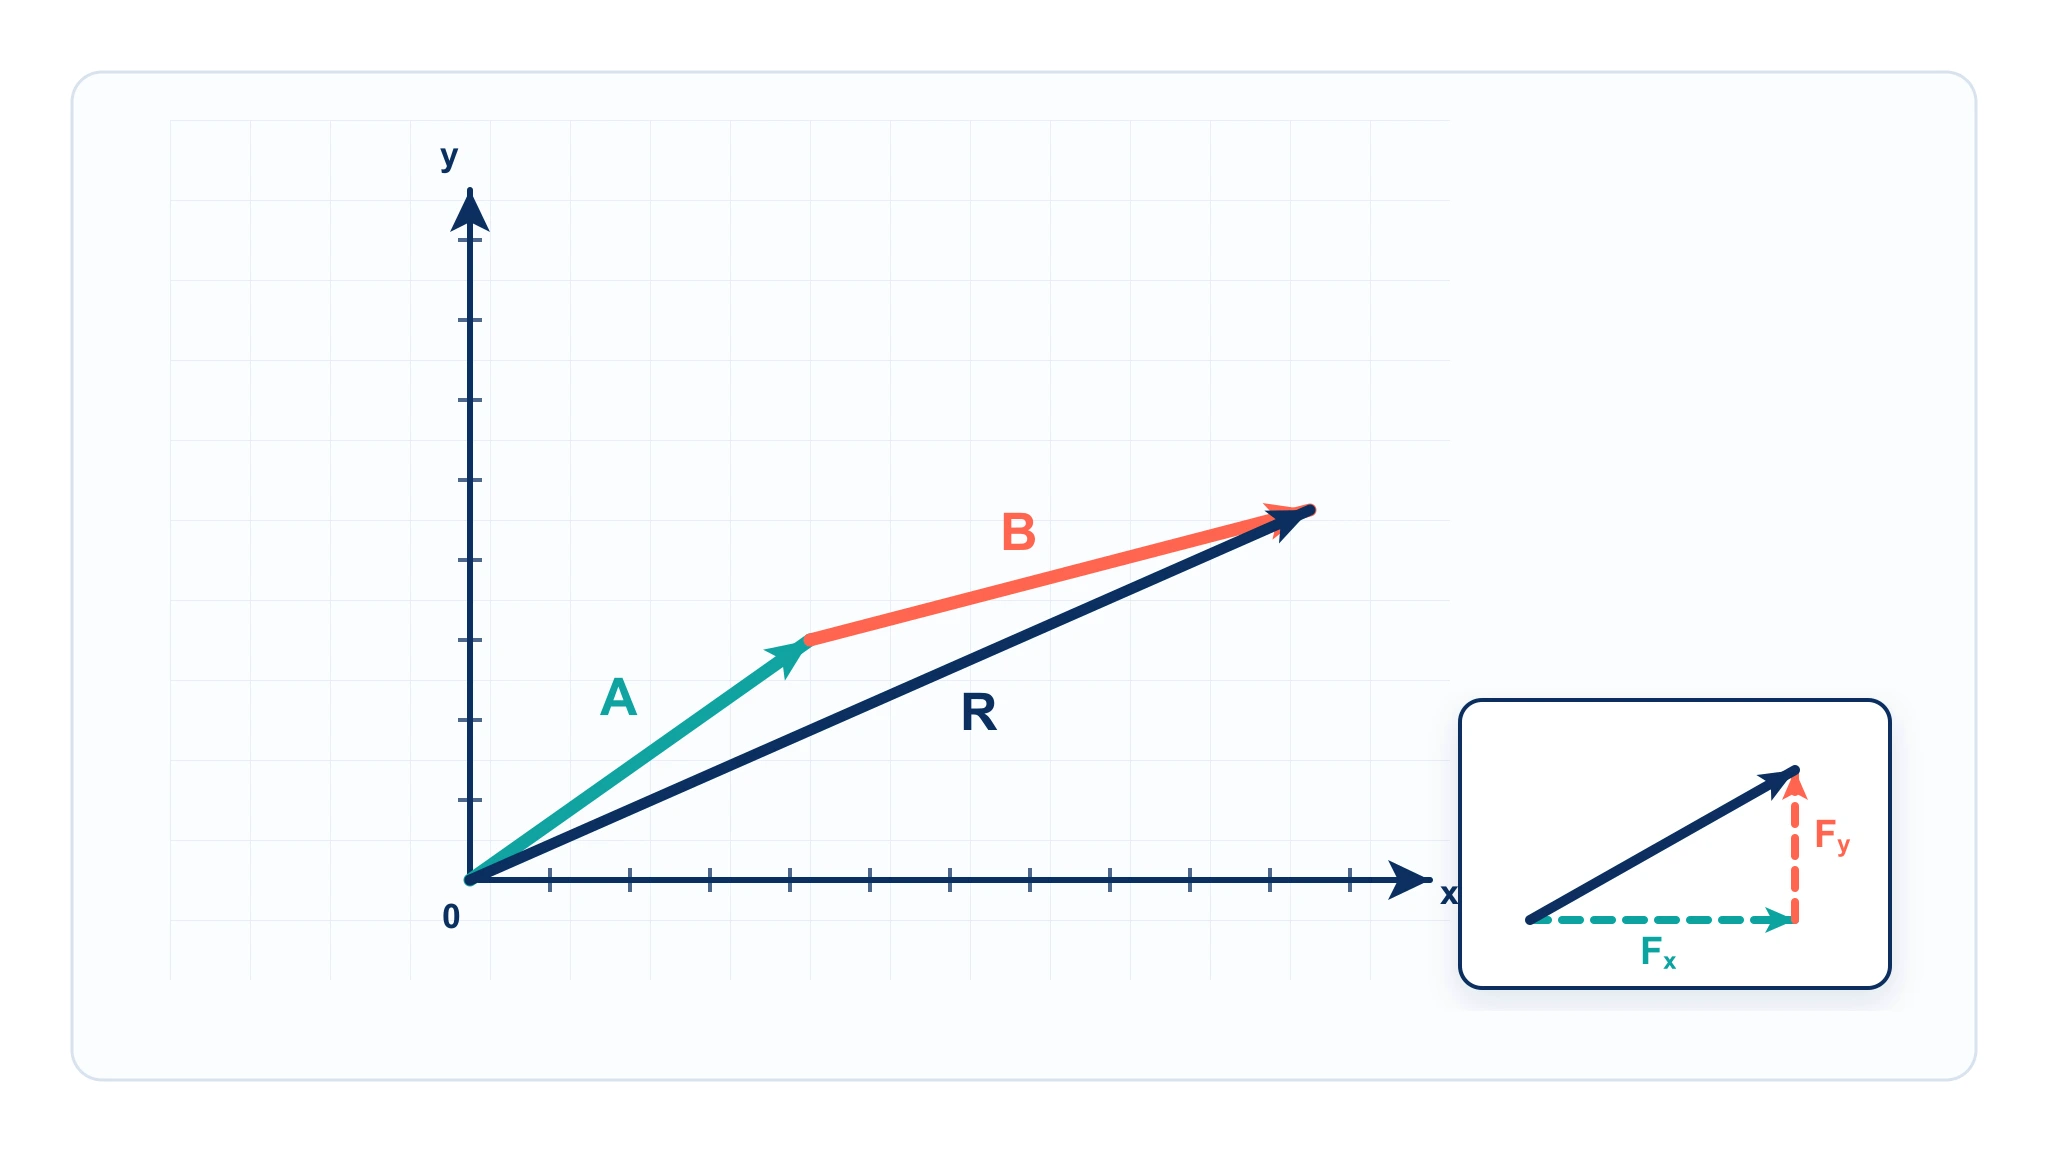
Vector Diagram Physics Guide
Learn how vector arrows, components, resultants, and scale diagrams work in physics.
 Education
AI Worksheet Generator
Generate printable physics worksheets and answer keys from your own classroom scenario.