Blog
Consejos de enseñanza, comparaciones de herramientas y guías de diagramas científicos para educadores STEM. Crea mejores materiales para el aula con generación de diagramas con IA.
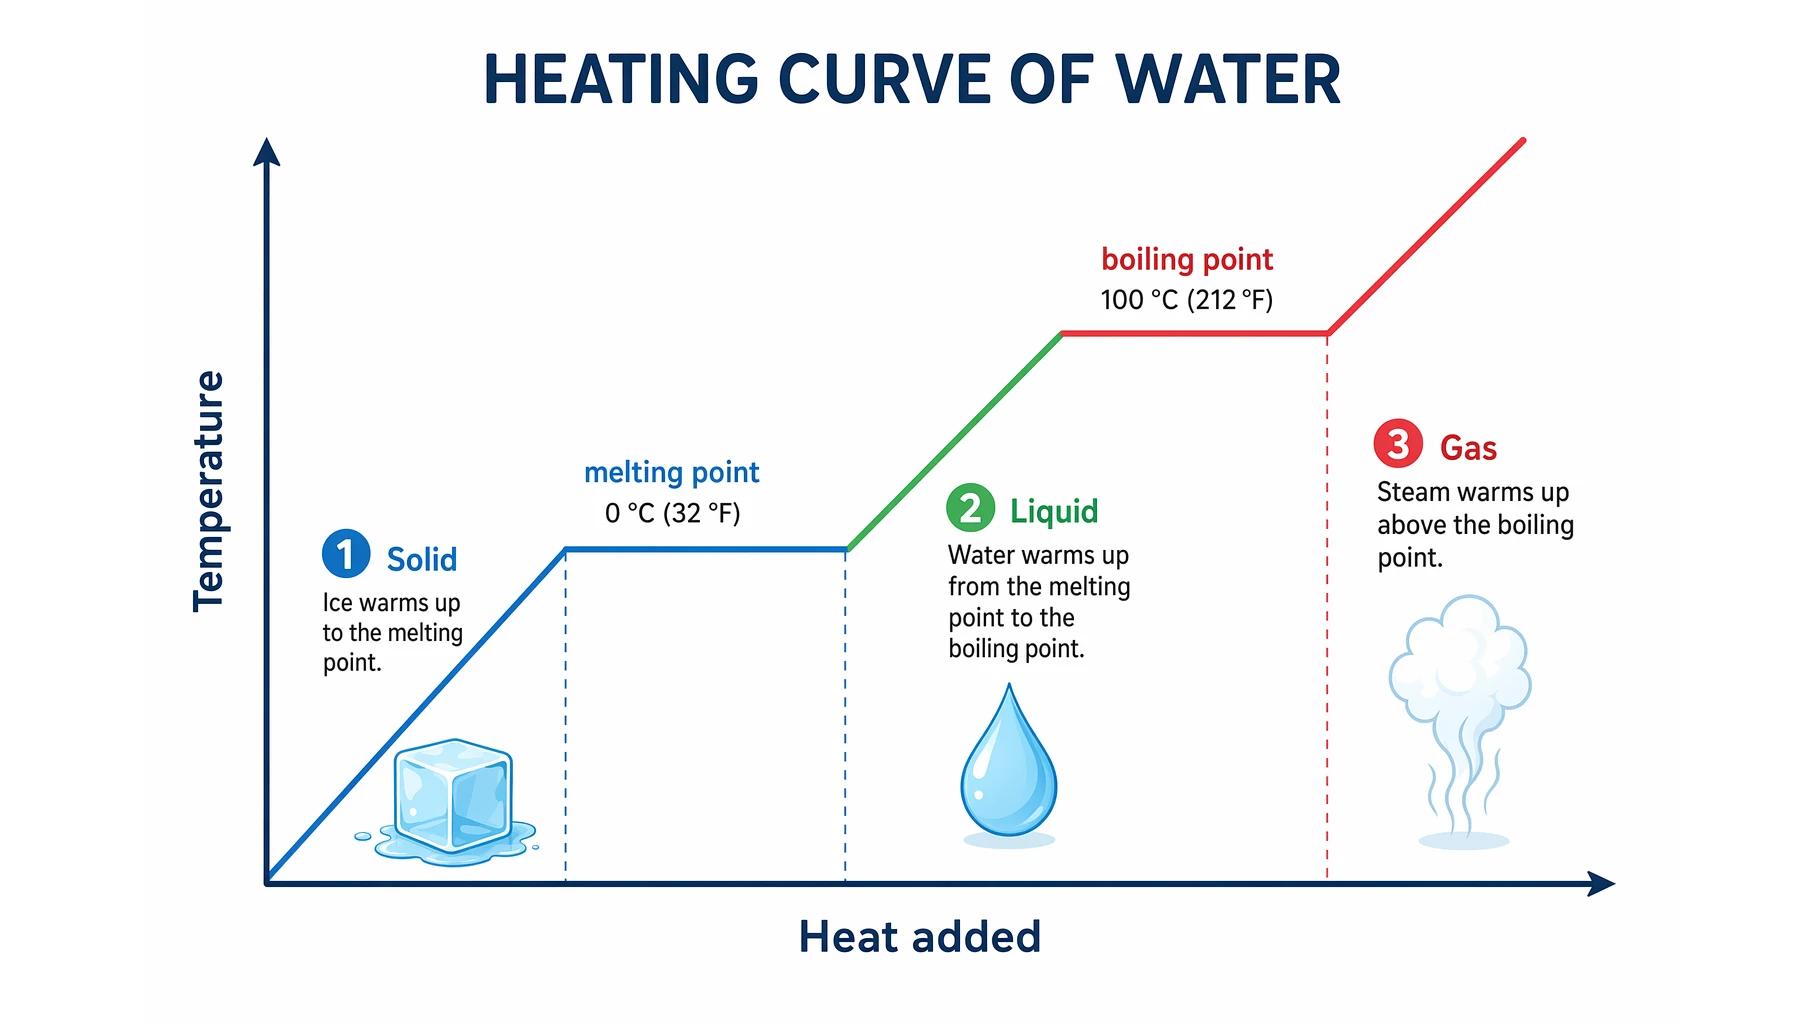
Heating Curve of Water Explained: The 5 Stages
Understand the heating curve of water step by step: what the axes mean, why the plateaus are flat, and how specific and latent heat shape each stage.
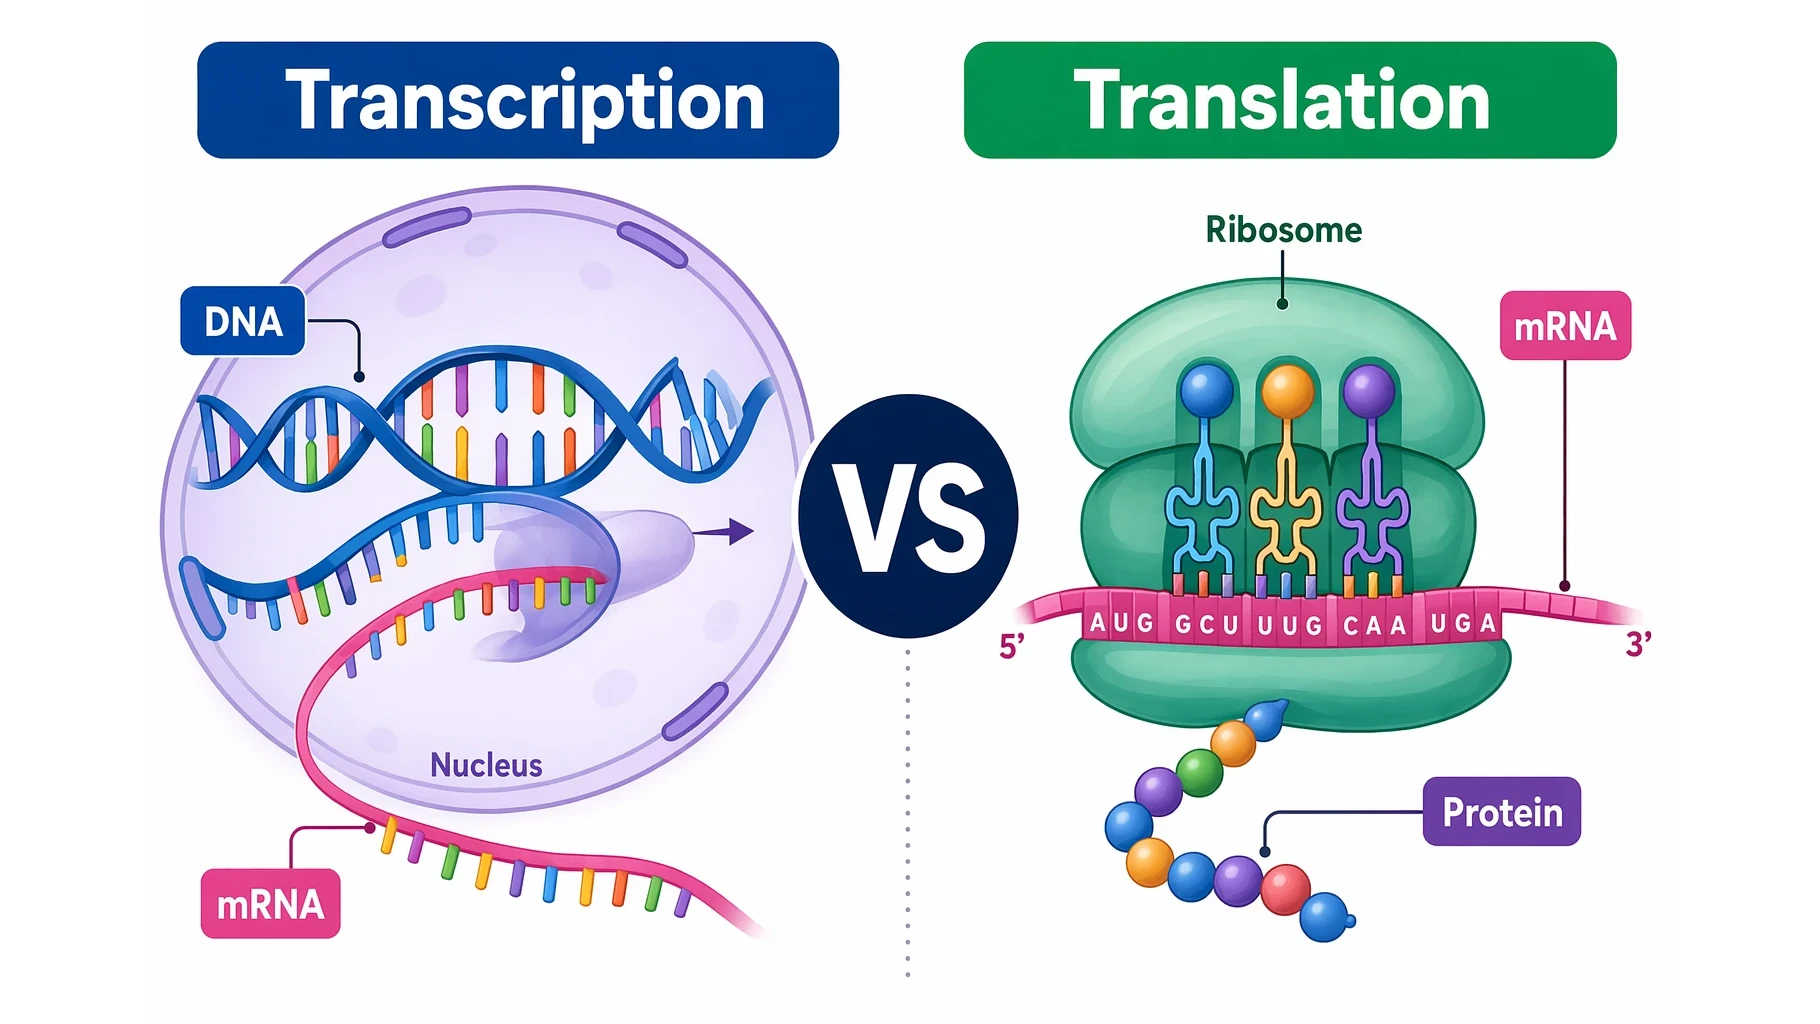
Transcription vs Translation: Key Differences Explained
Transcription vs translation made simple: compare location, enzymes, templates, and products side by side, with diagrams of how DNA becomes RNA and protein.
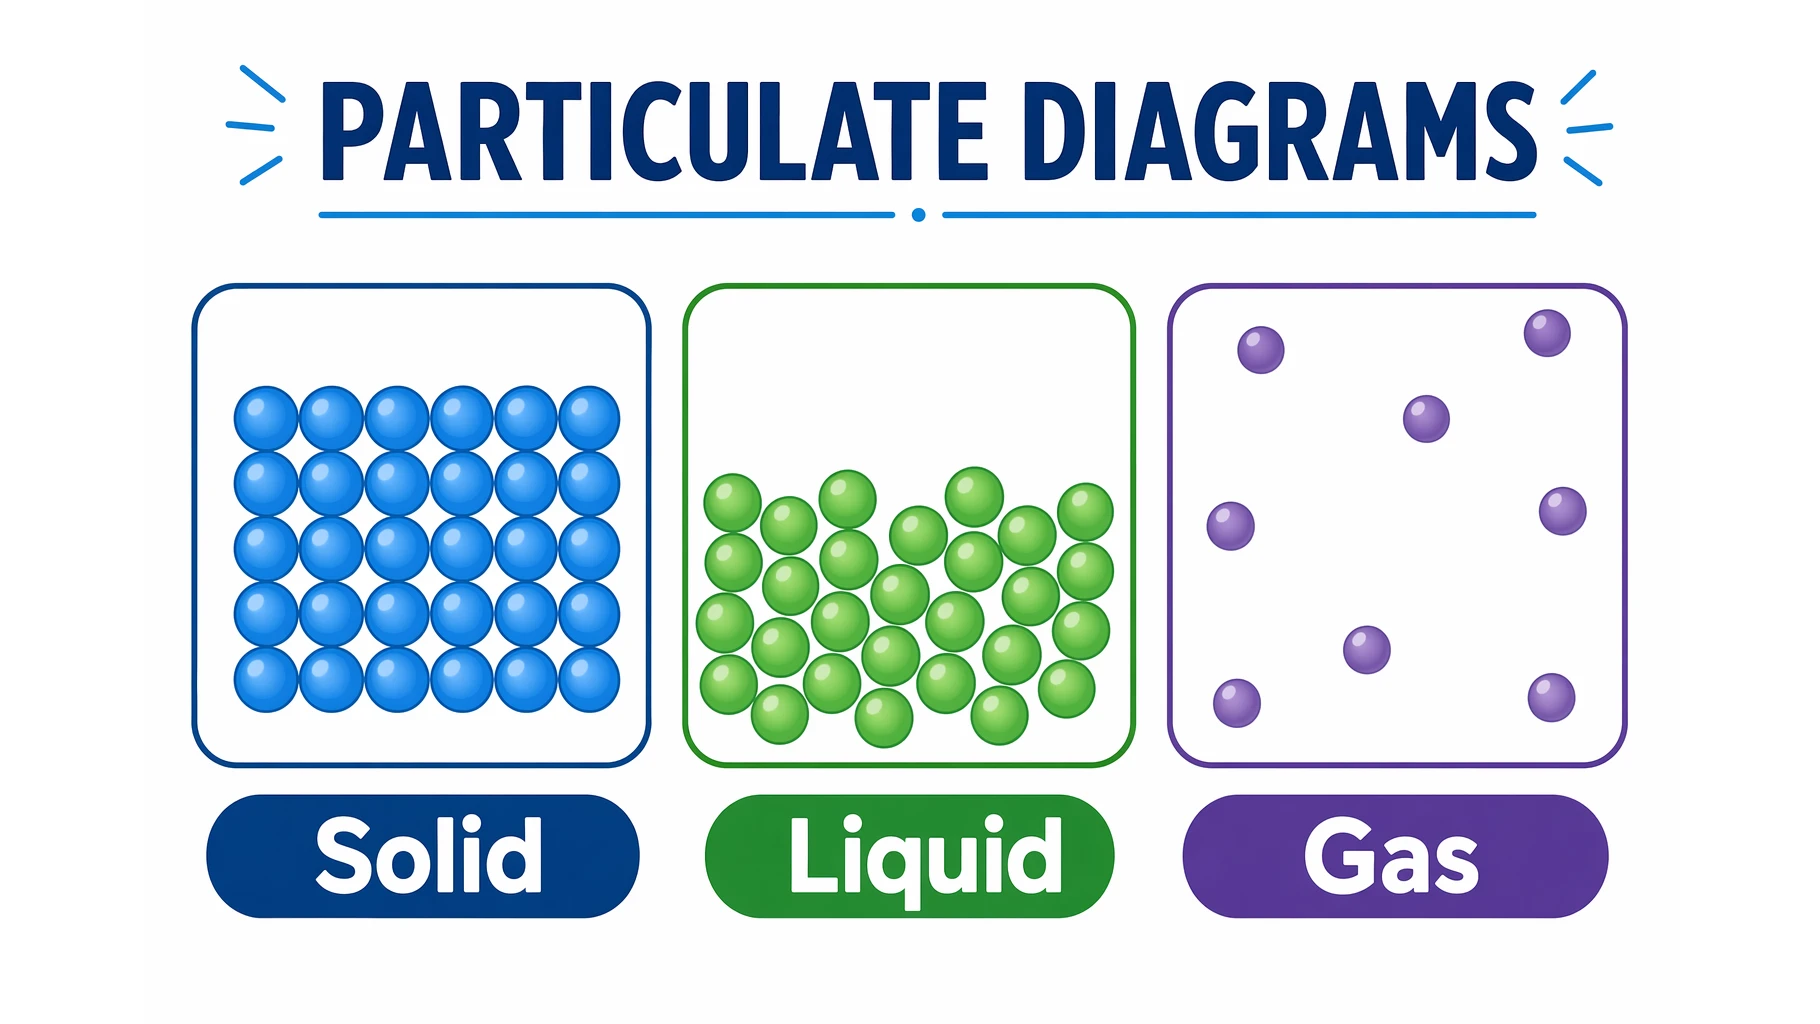
What Is a Particulate Diagram? Particle Models Explained
A particulate diagram shows matter as individual particles. Learn how particle diagrams represent solids, liquids, gases, elements, and mixtures, with examples.
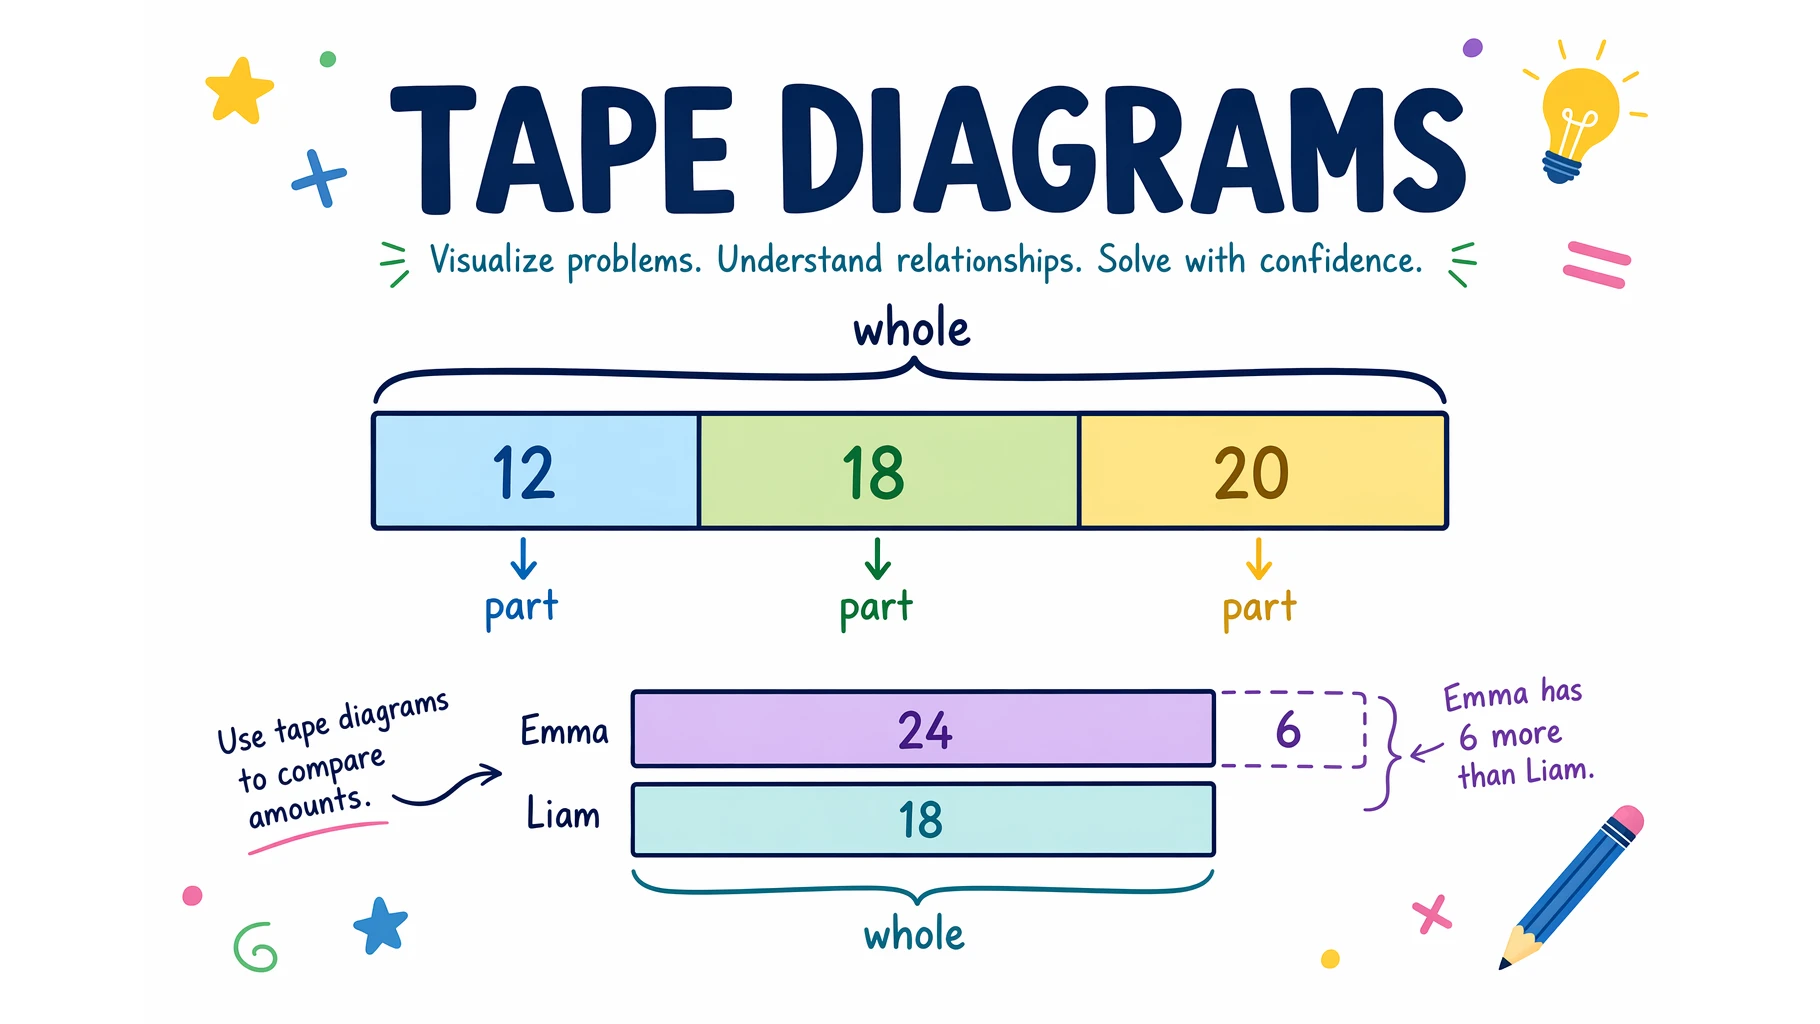
What Is a Tape Diagram? Examples for Every Operation
A tape diagram (bar model) makes word problems visual. See how it works for addition, subtraction, multiplication, division, ratios, and fractions.
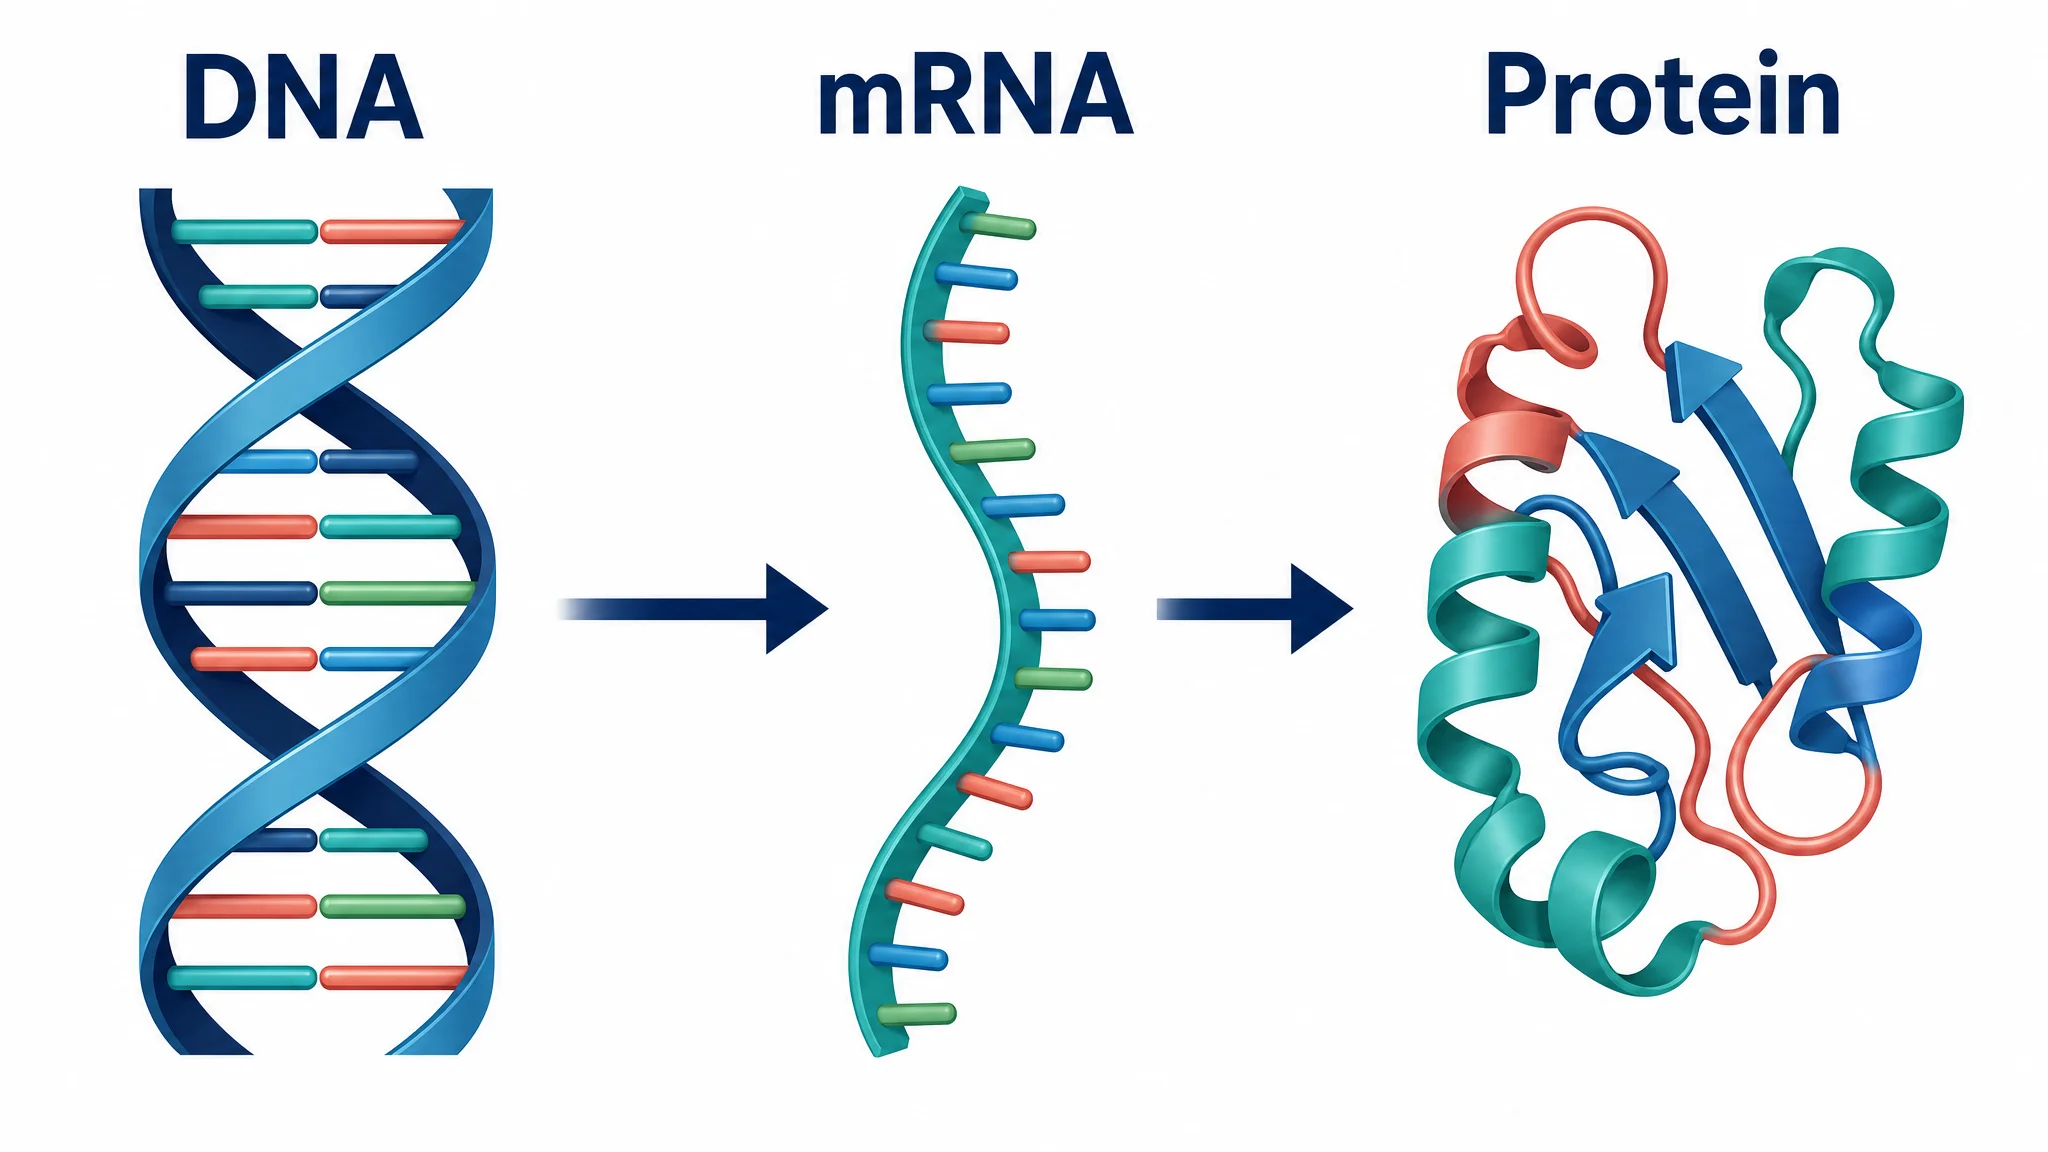
Central Dogma Diagram Guide: DNA to RNA to Protein
Learn how to read and draw a central dogma diagram, including DNA, mRNA, transcription, translation, ribosomes, codons, and common mistakes.

Column Chart Maker Guide: When to Use Column Charts and How to Make One
Learn when to use a column chart, how it differs from a bar chart, and how to make clean grouped, stacked, and spreadsheet-ready column charts.