Blog
Consejos de enseñanza, comparaciones de herramientas y guías de diagramas científicos para educadores STEM. Crea mejores materiales para el aula con generación de diagramas con IA.
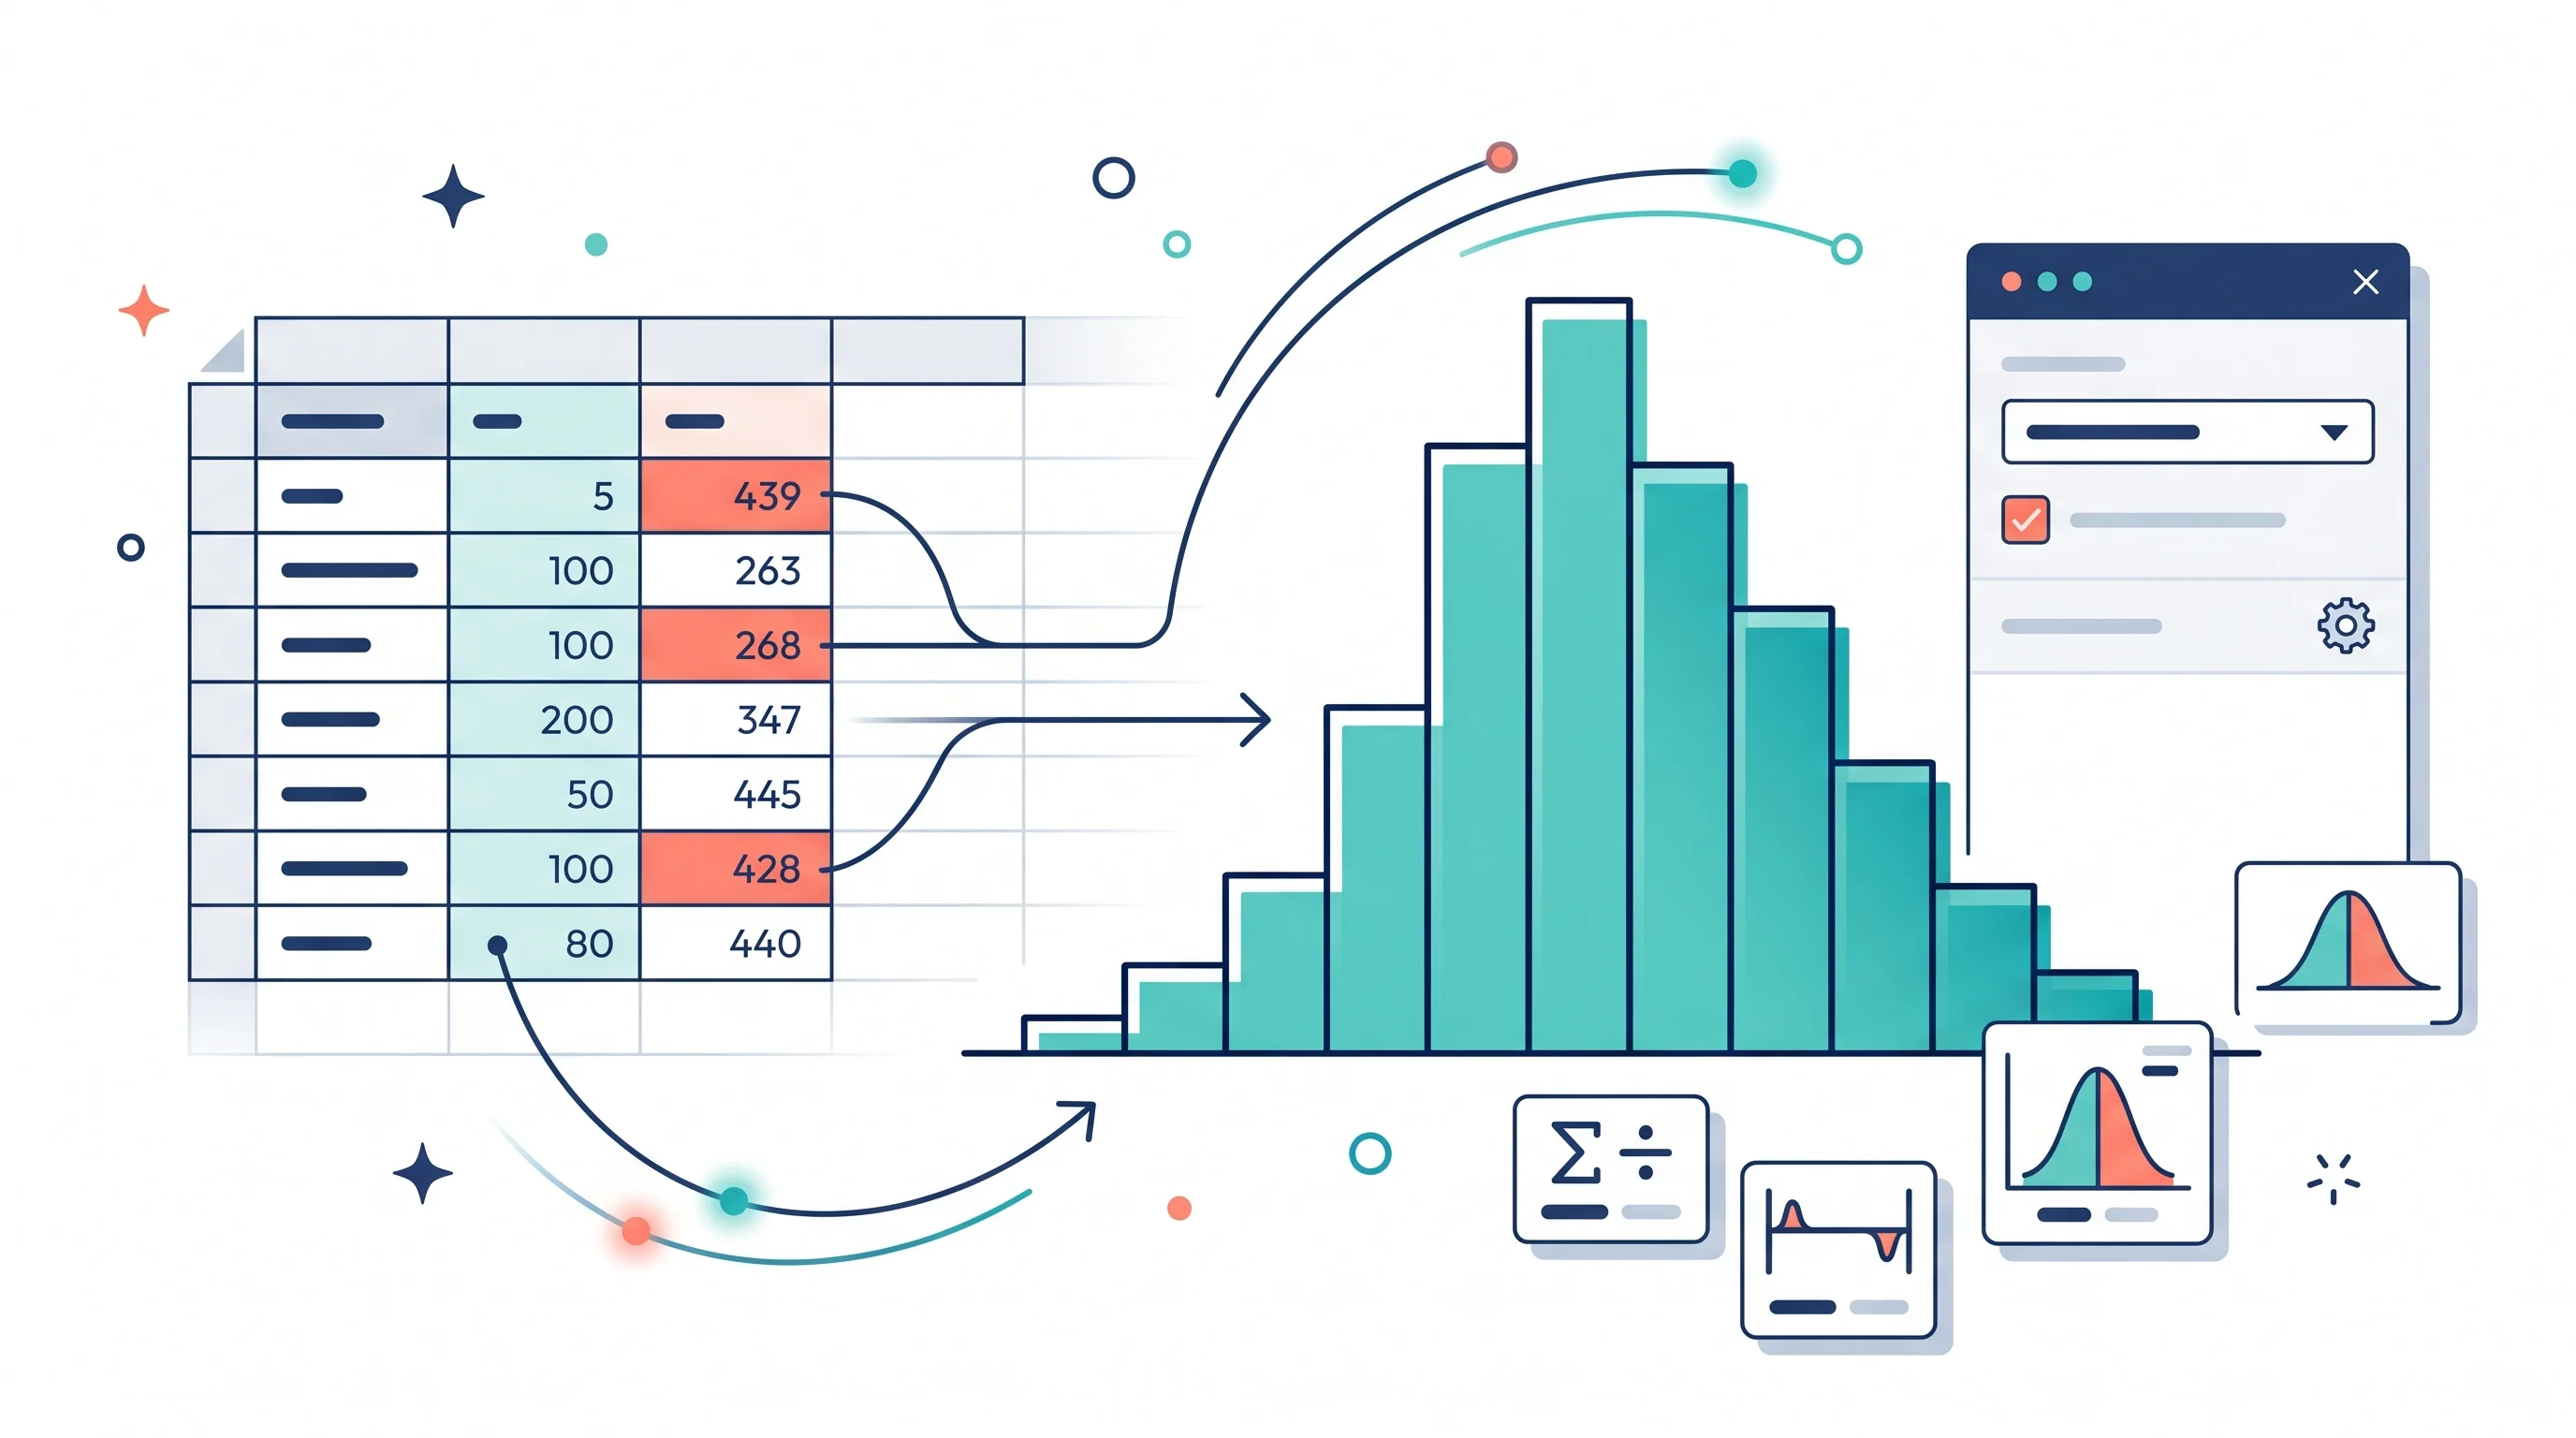
How to Make a Histogram in Google Sheets: Bins, Frequency Tables, and Chart Editor Tips
Learn how to make a histogram in Google Sheets, change bucket size, use frequency tables, fix common chart issues, and format a readable distribution chart.
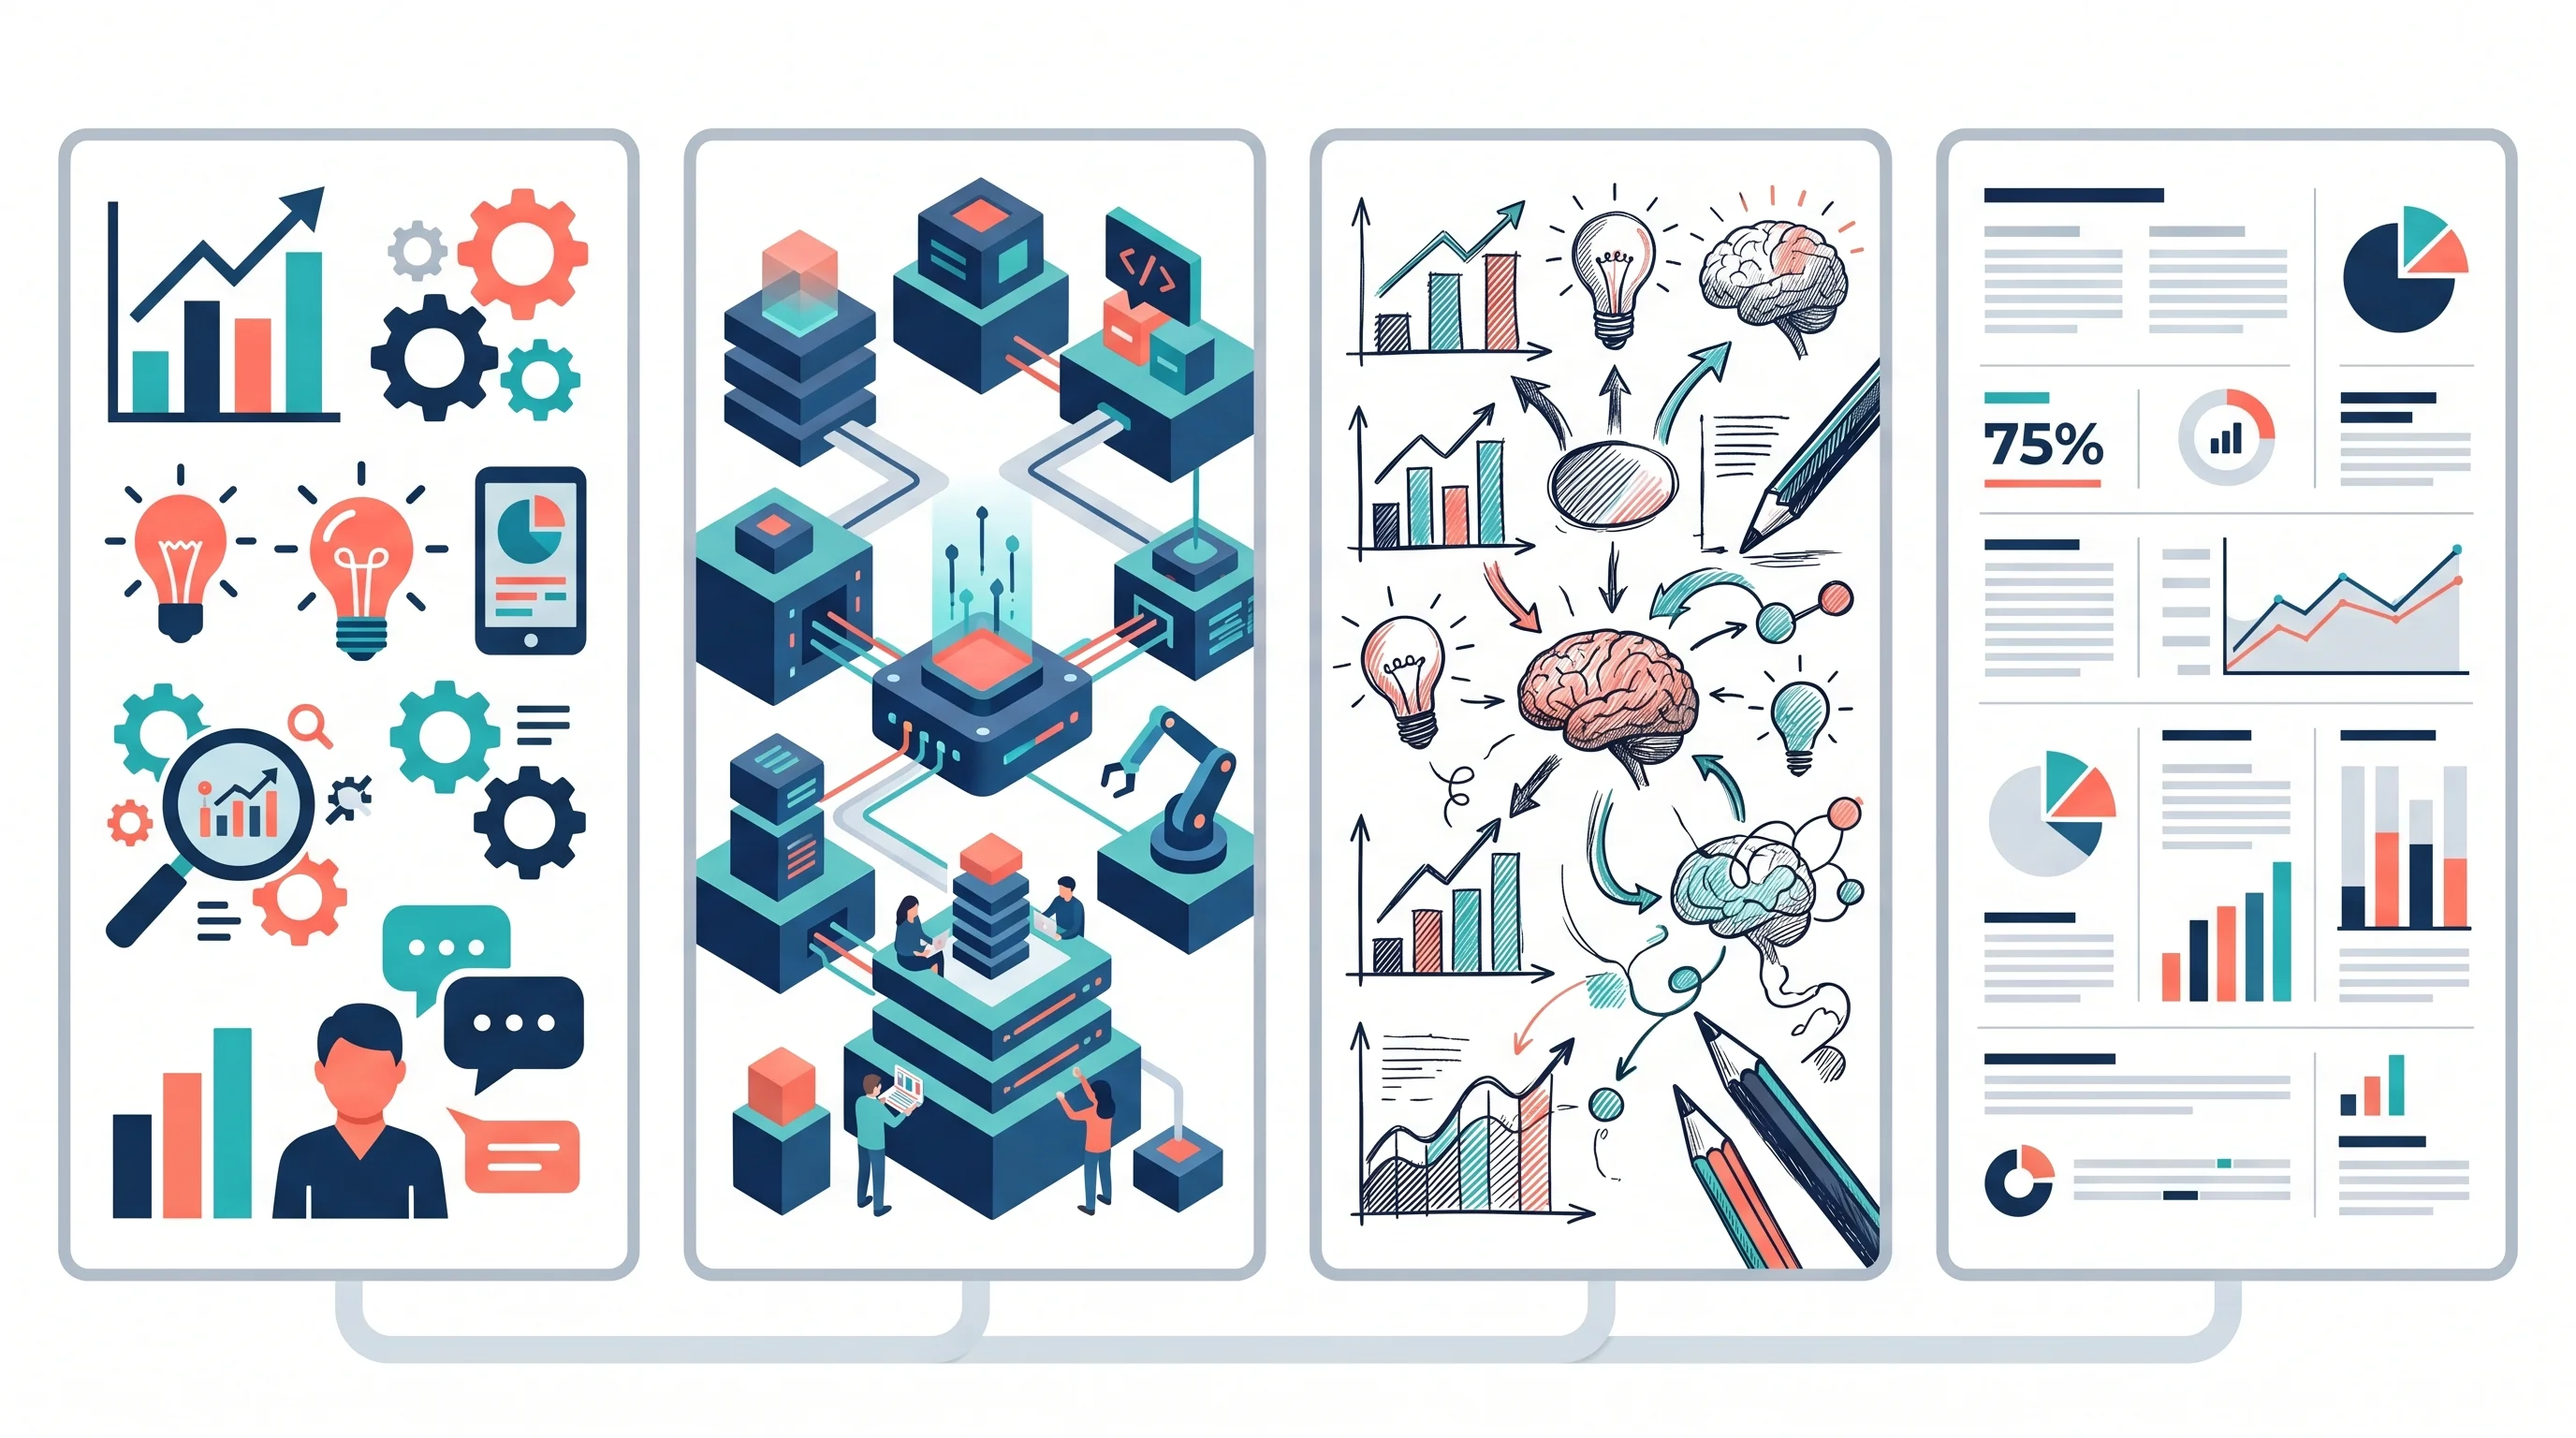
Infographic Design Styles & Trends: Flat, Isometric, Hand-Drawn and Minimalist
Compare infographic design styles and trends: flat, isometric, hand-drawn, minimalist, 3D and editorial layouts, with examples and selection rules.
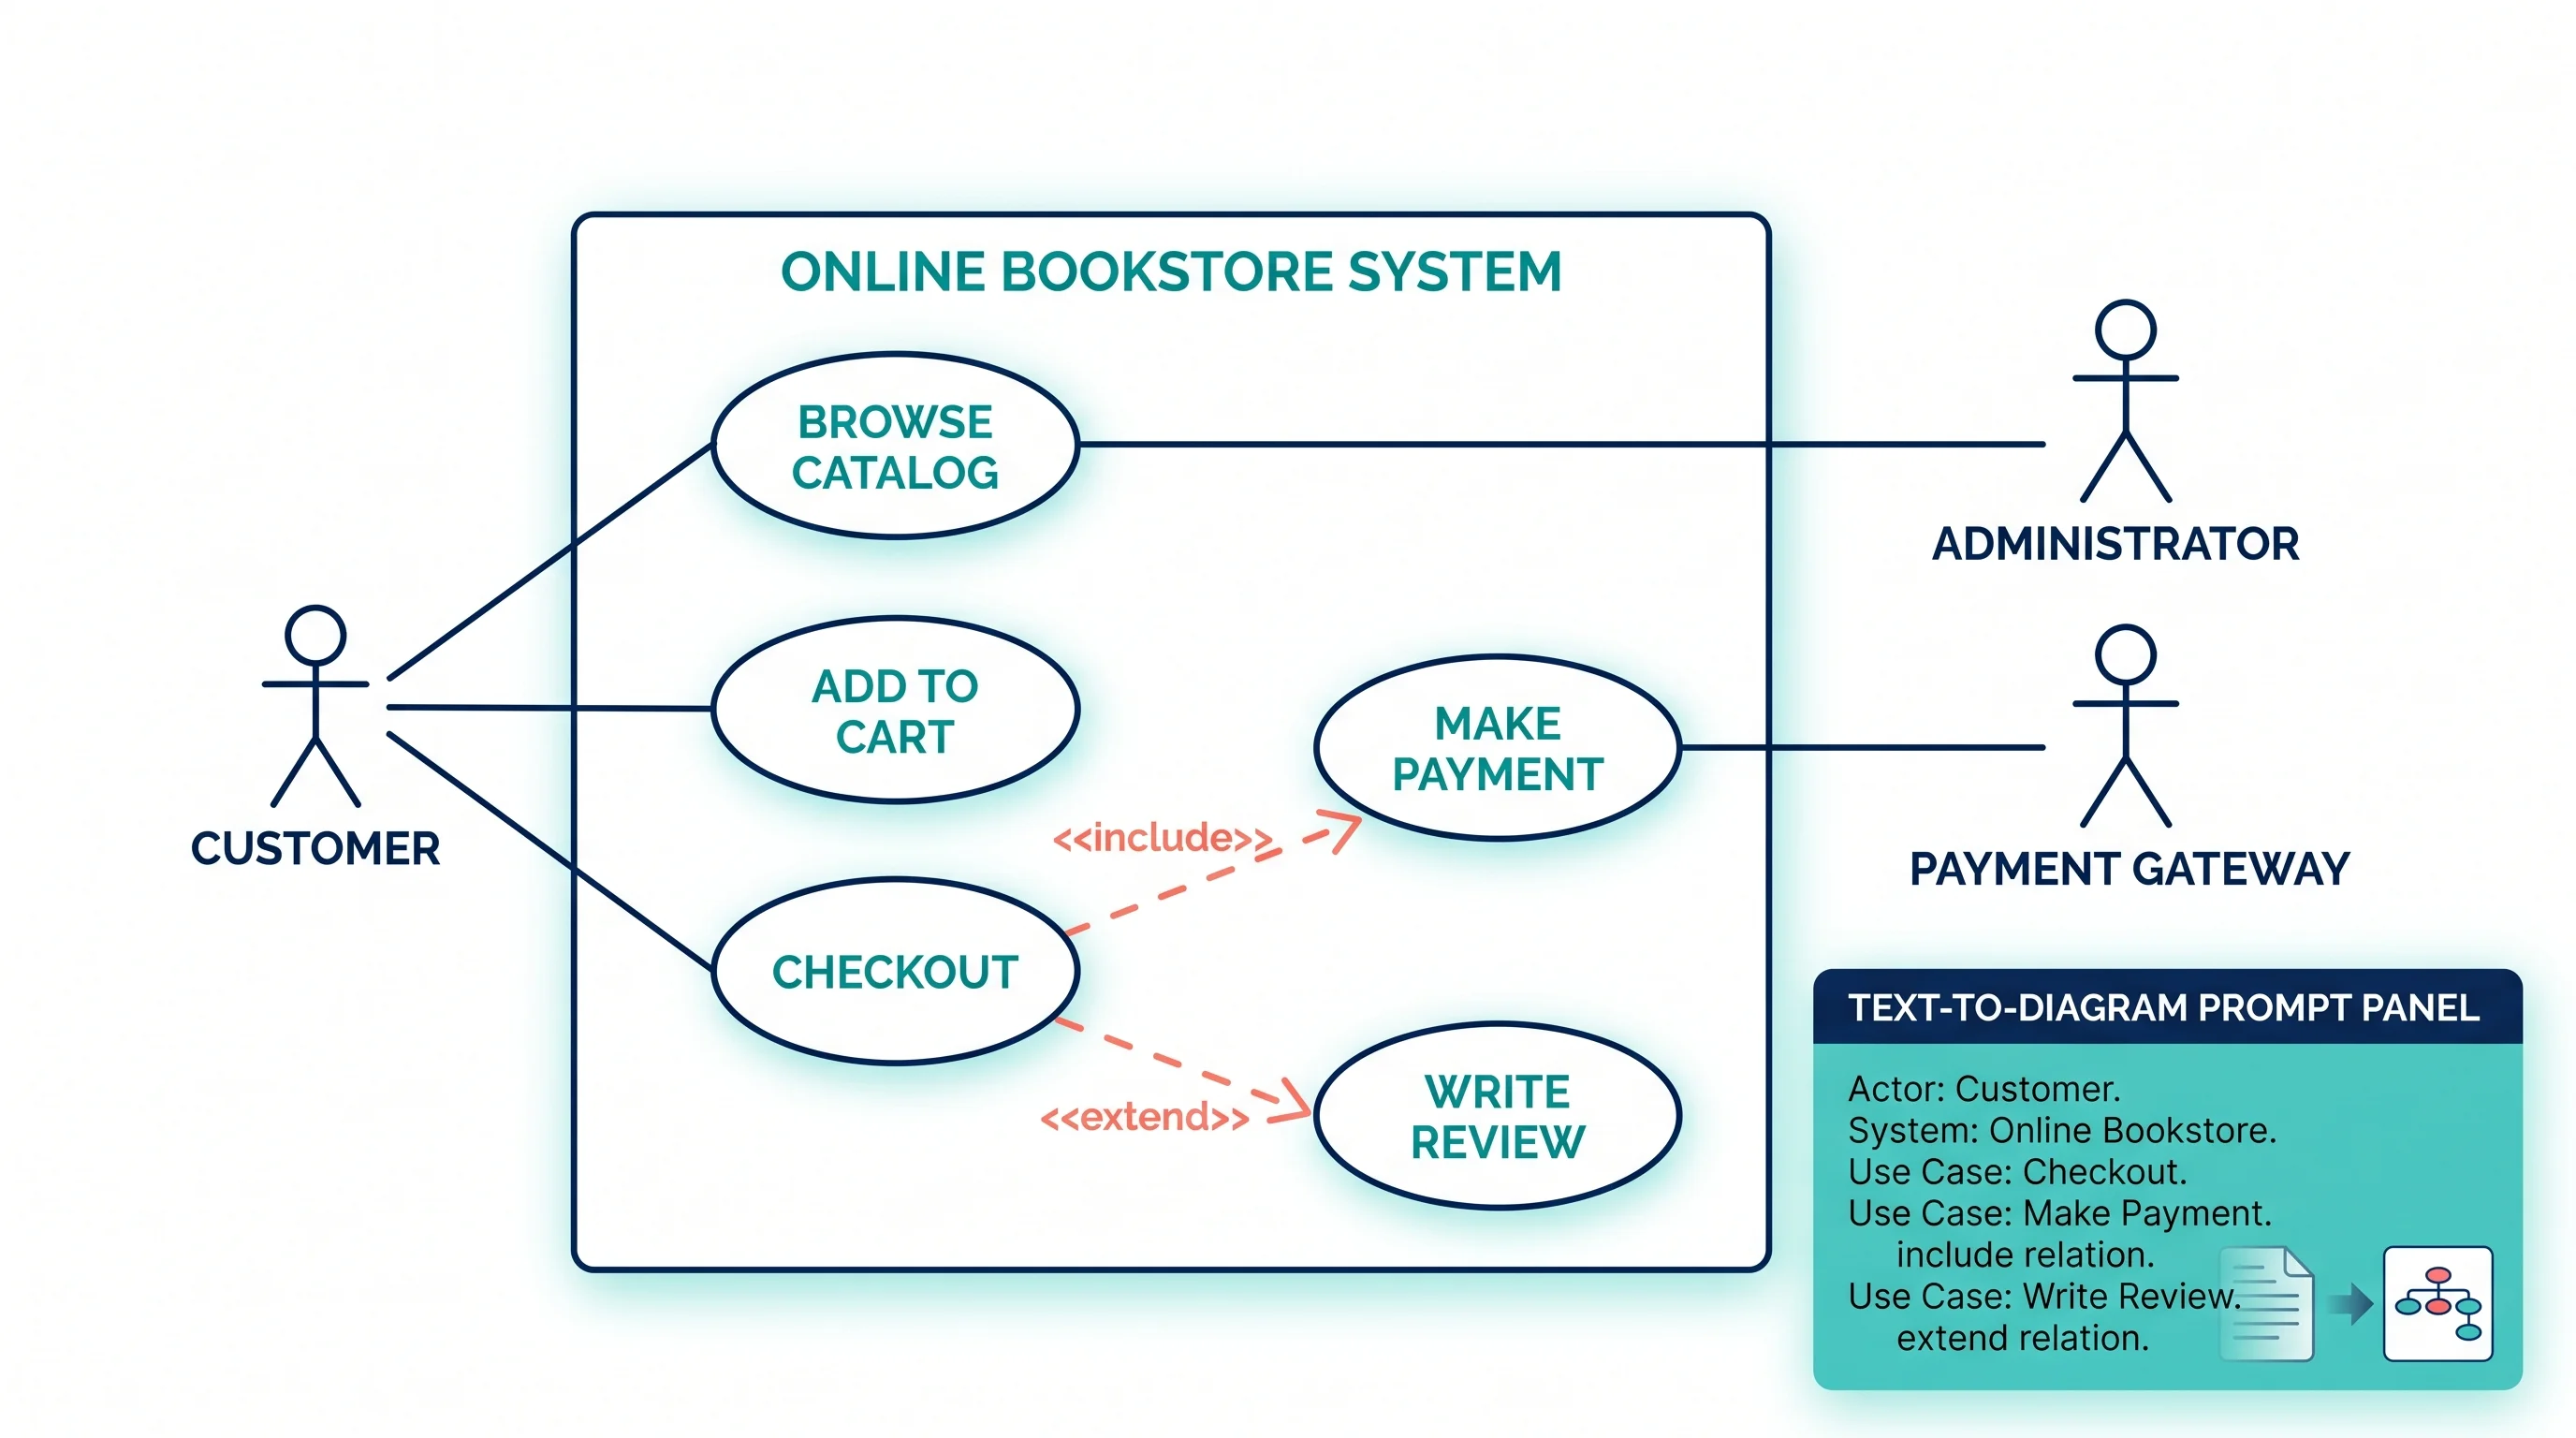
Use Case Diagram Generator Guide: Create UML Use Cases from Text
Learn how to use a use case diagram generator, define actors and system boundaries, write better prompts, and avoid common UML notation mistakes.
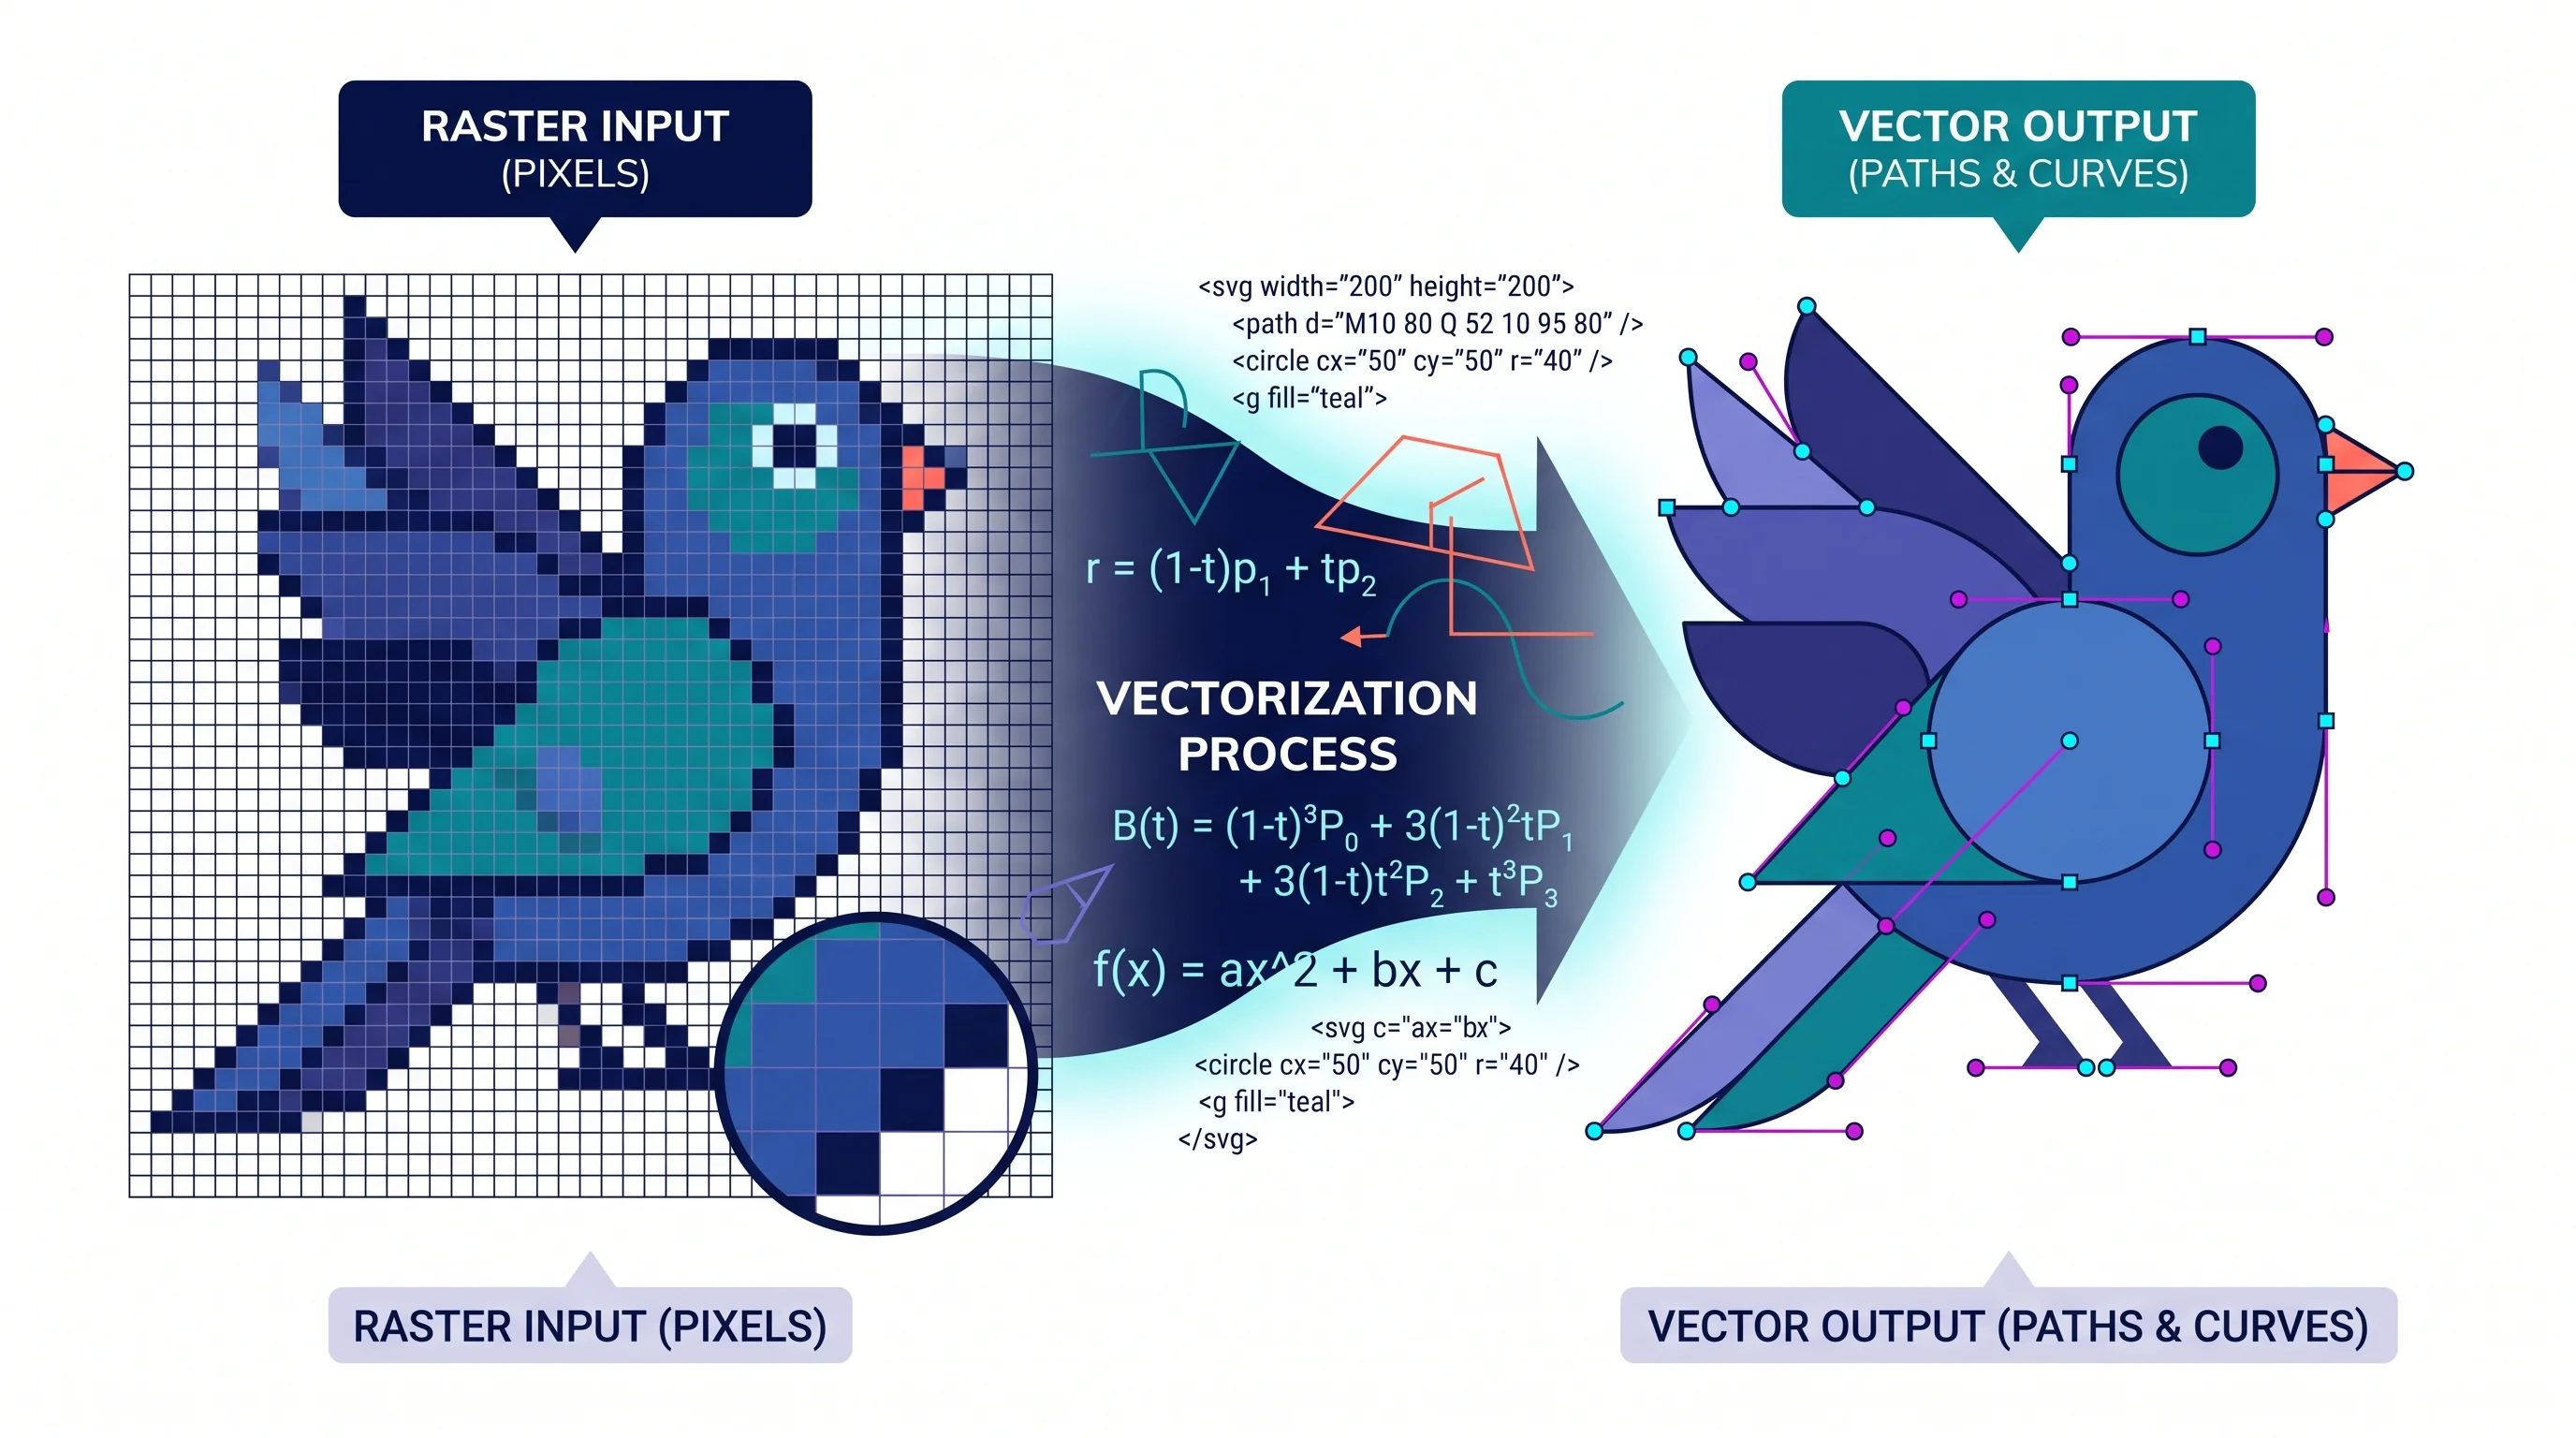
How to Create a Vector Image: A Complete Guide for Beginners and Researchers
Learn how to create vector images using Inkscape, Illustrator, and AI tools. Covers the SVG format, tracing raster images, and best practices for illustration.
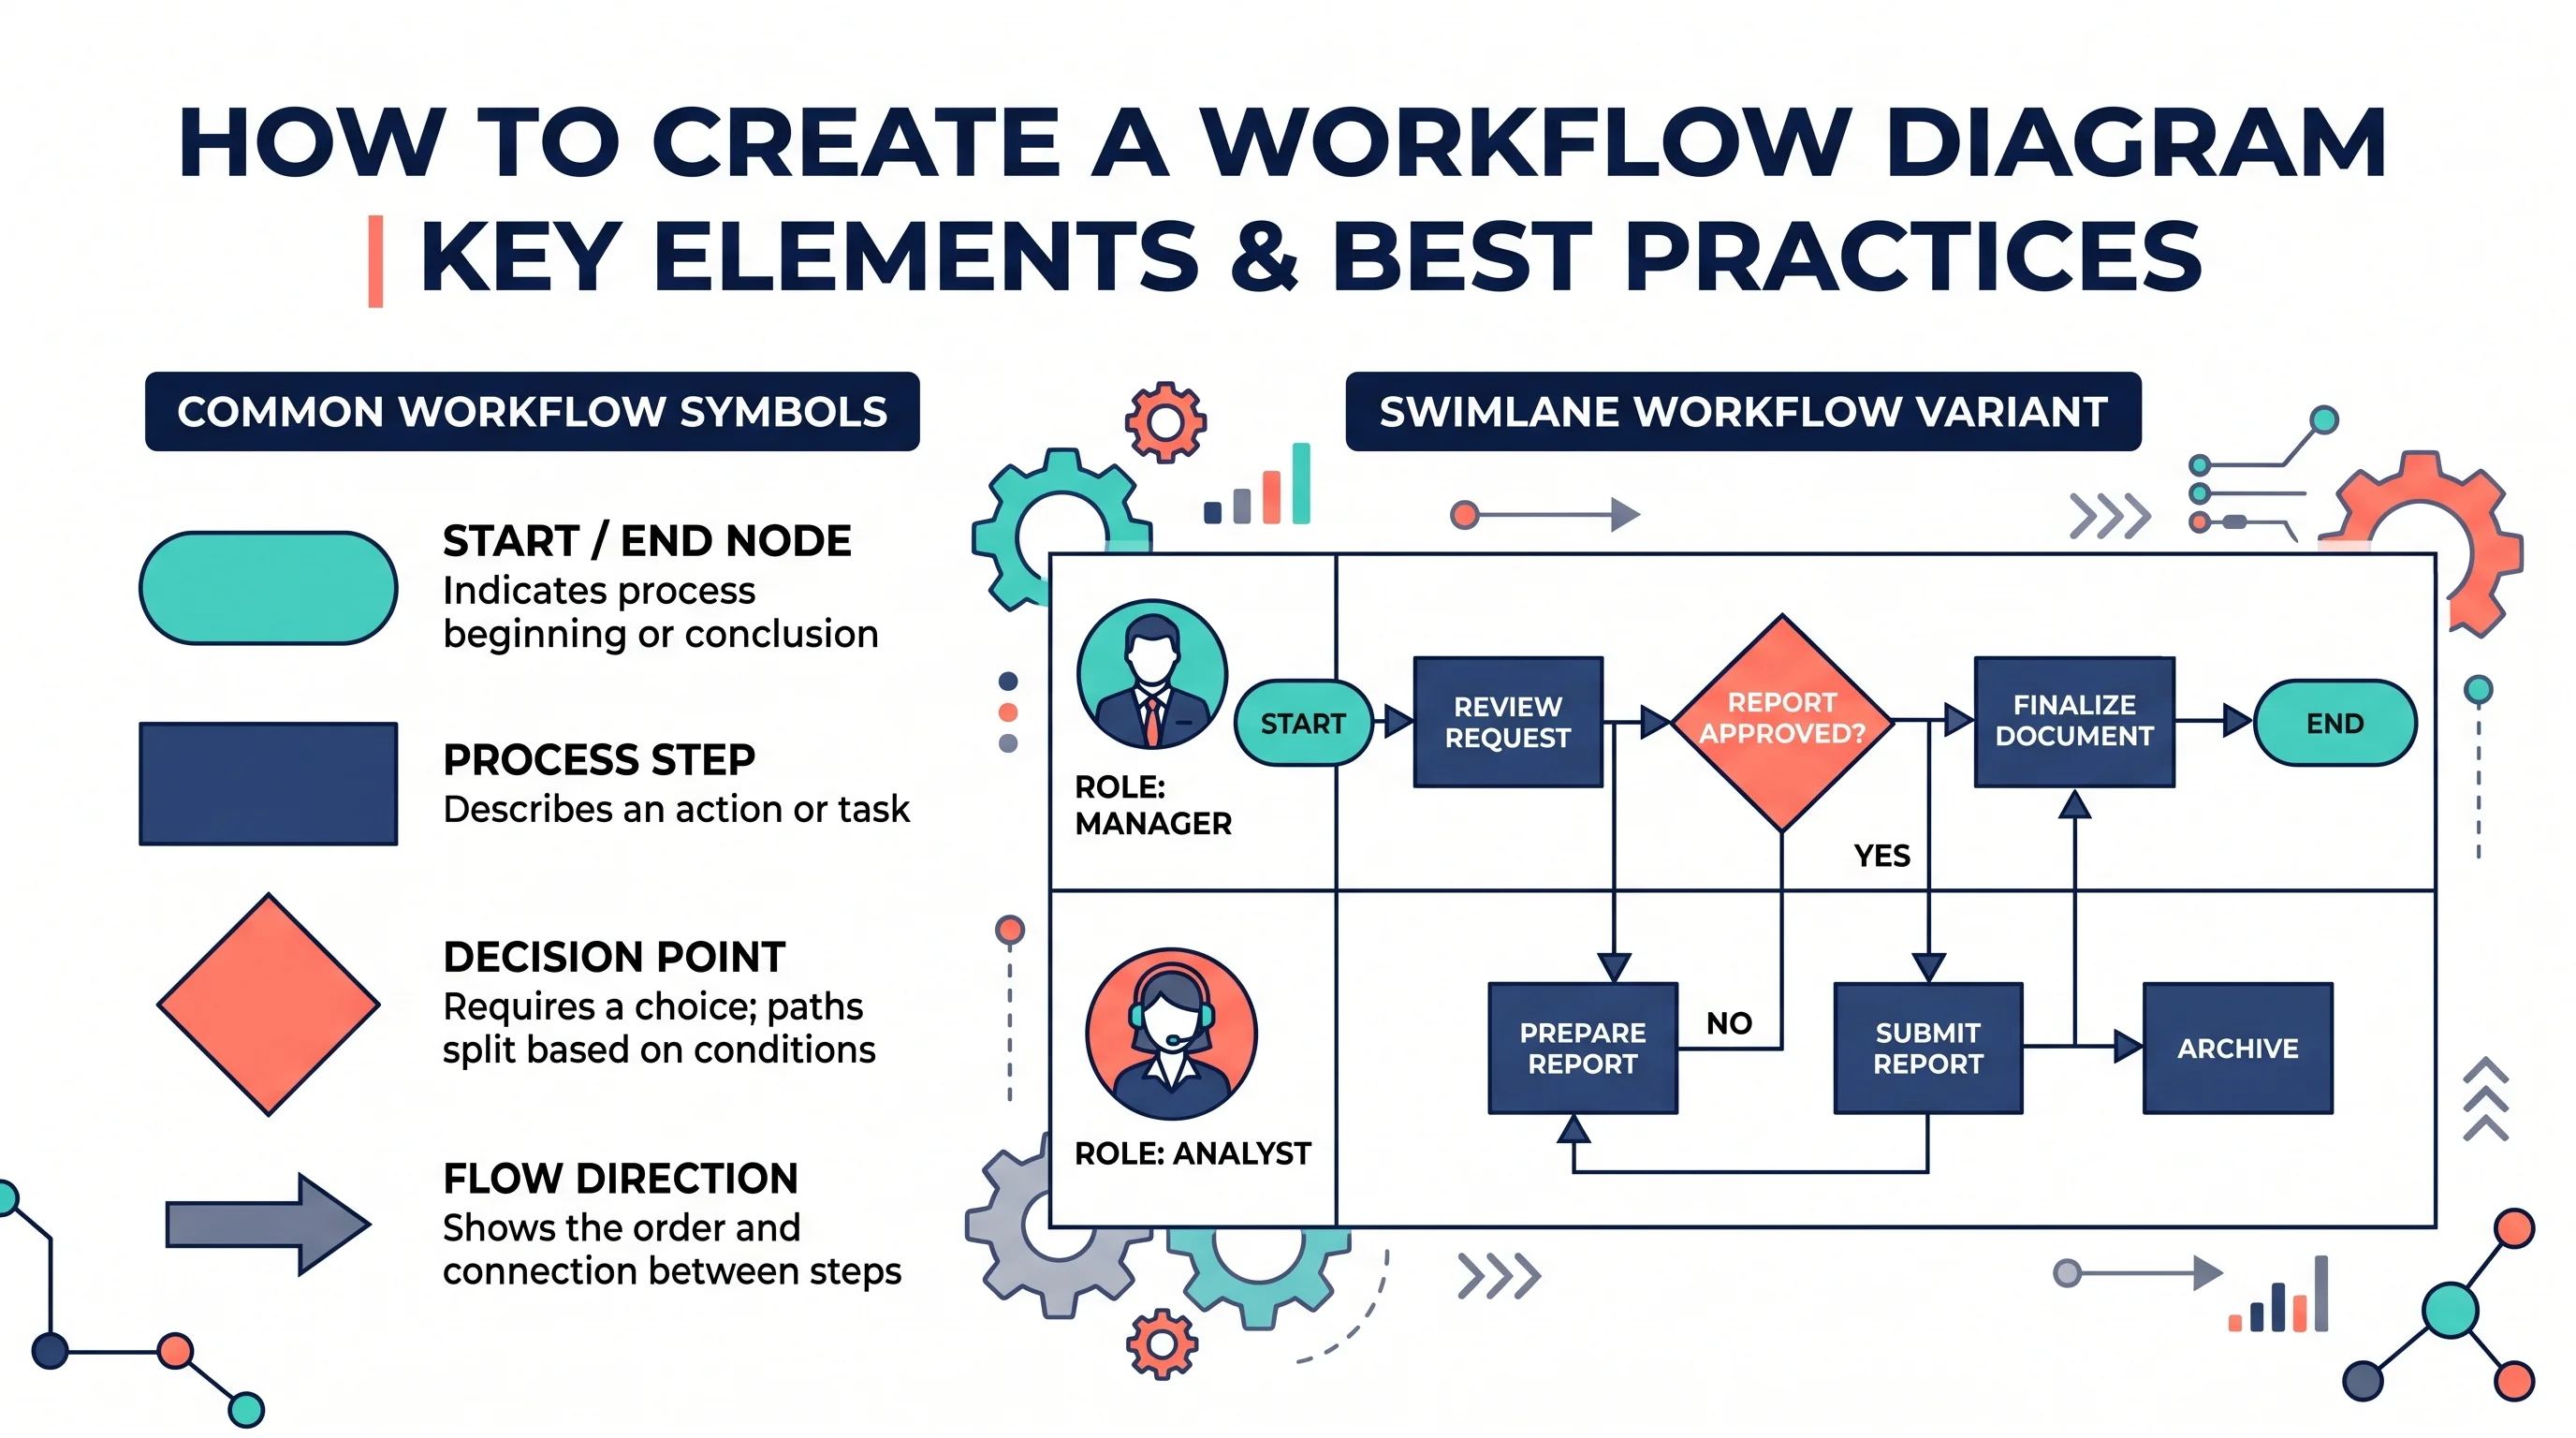
How to Create a Workflow Diagram: Step-by-Step Guide with Examples
Learn how to create a workflow diagram for research, business processes, and team projects, with symbols, types, best practices, and free tools.
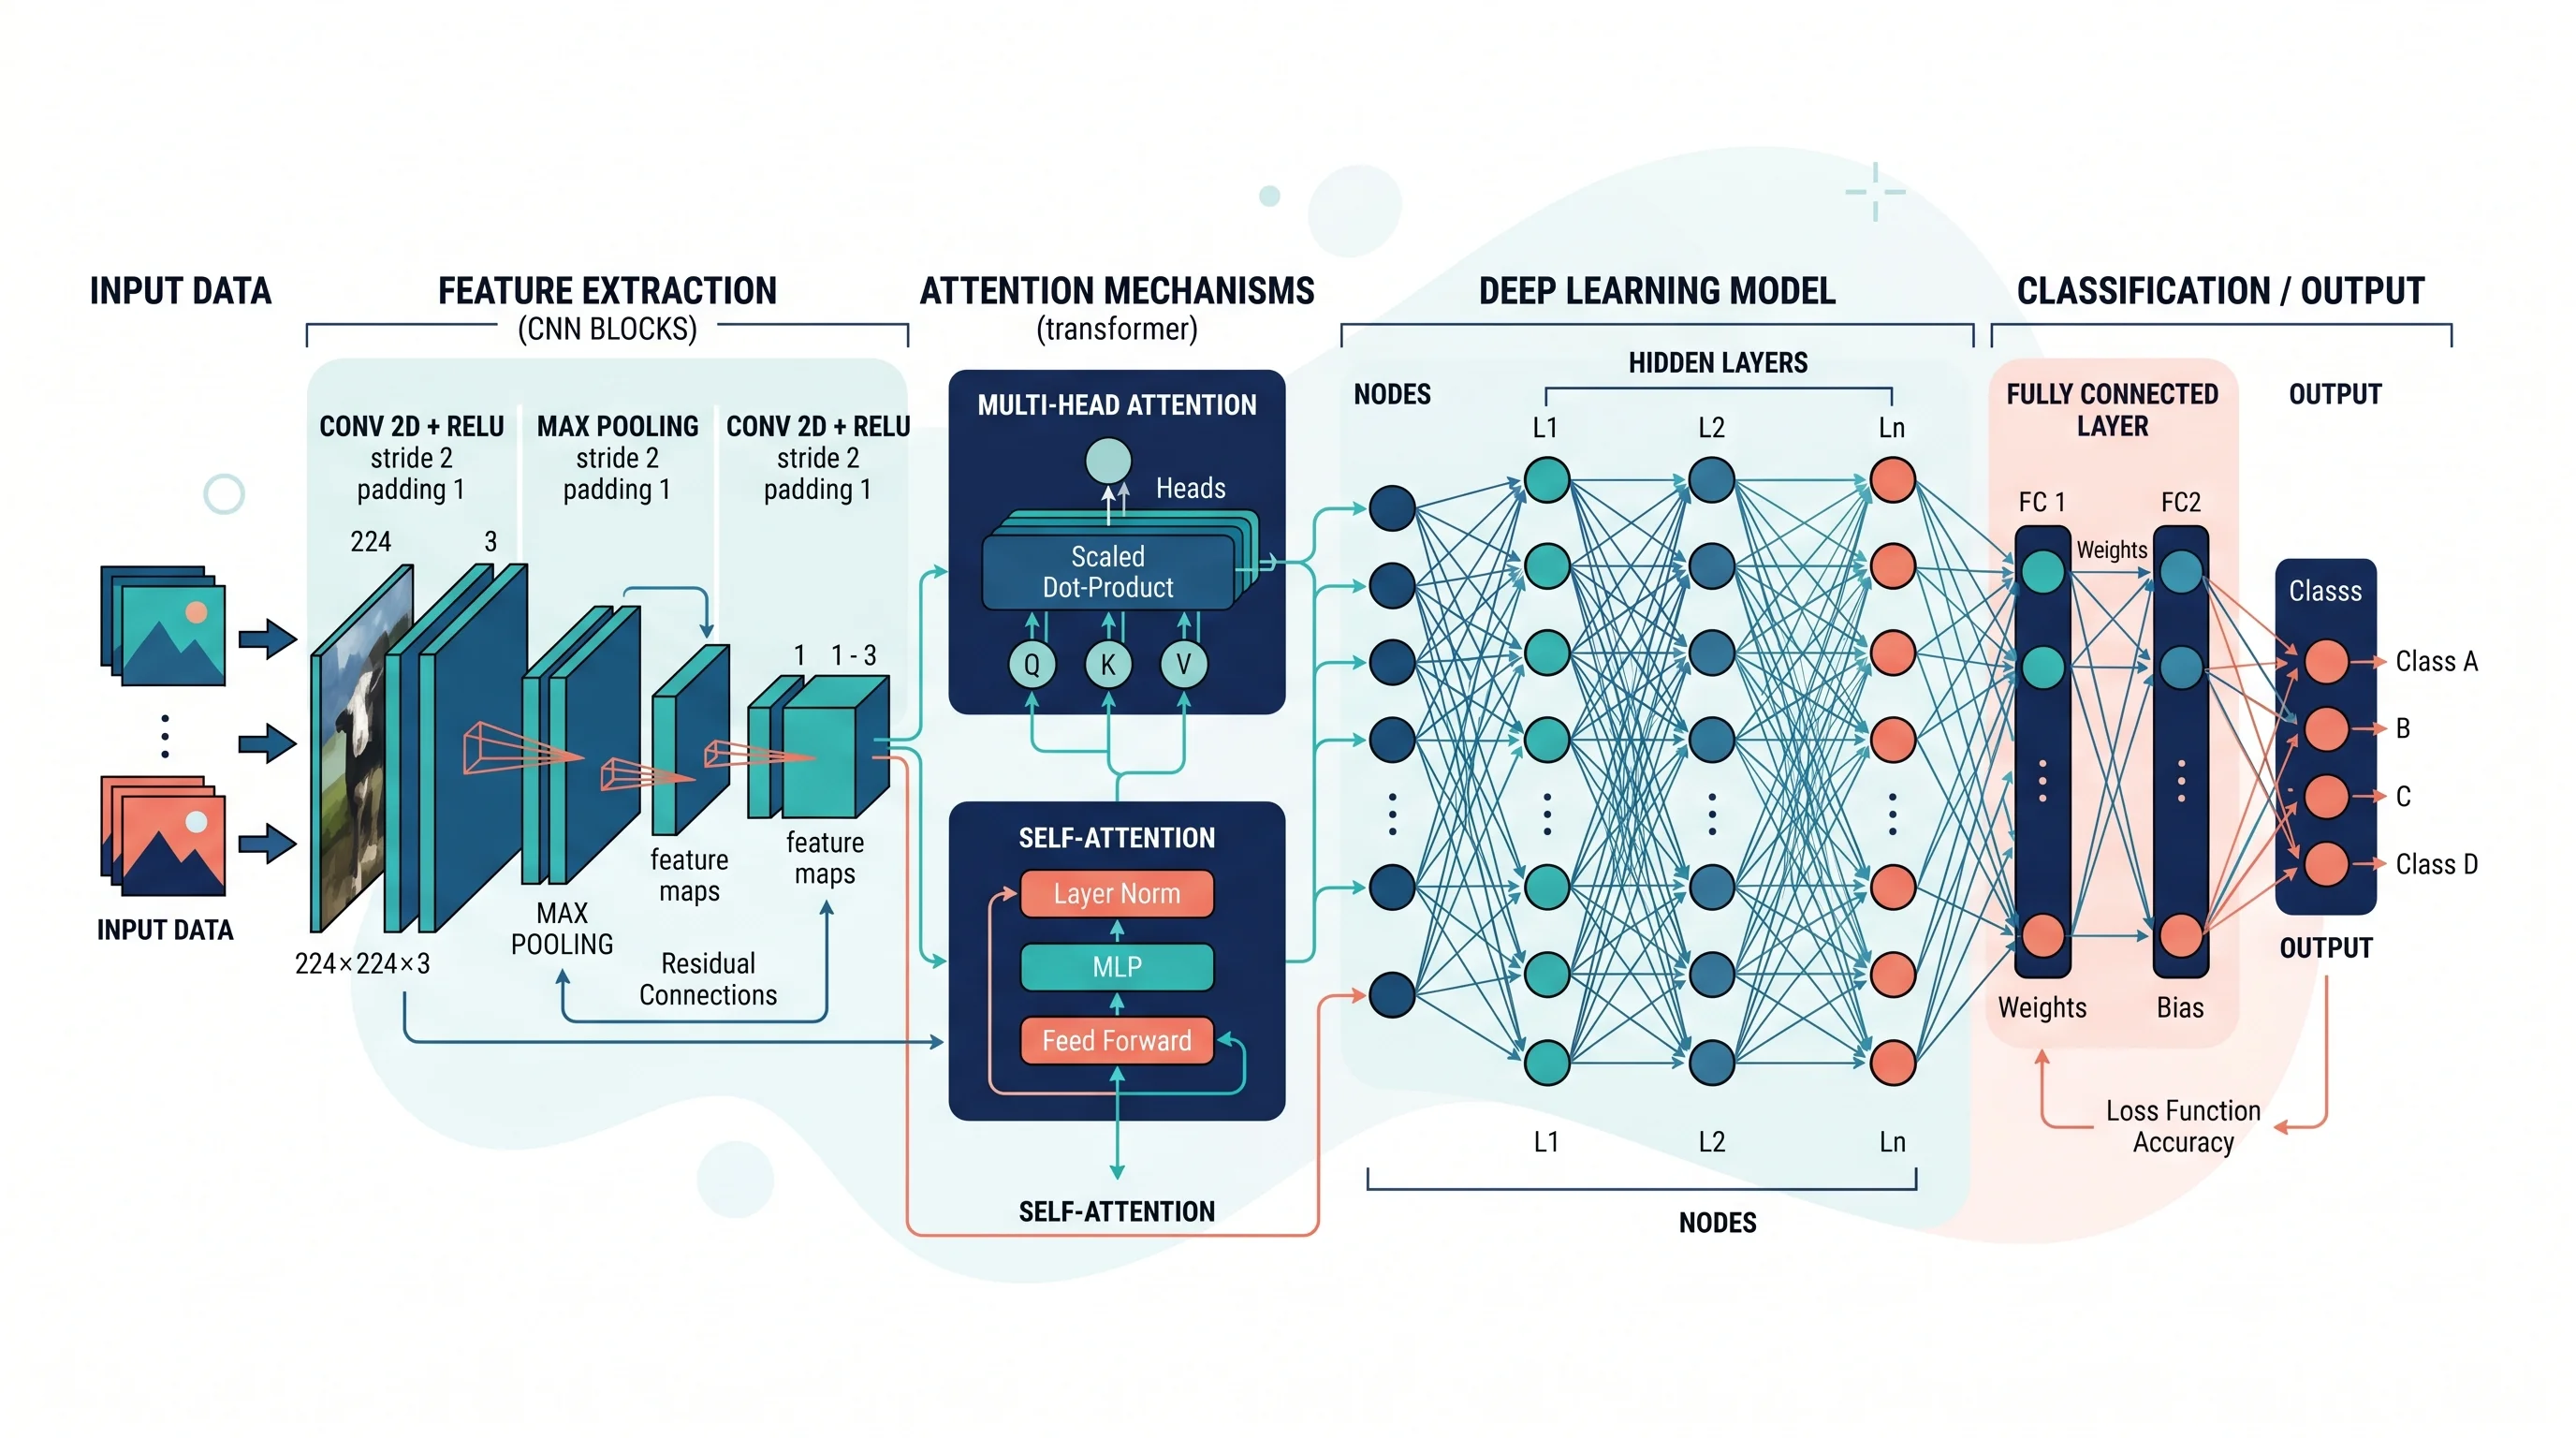
How to Draw a Neural Network Architecture Diagram: A Complete Guide
Learn how to draw neural network architecture diagrams for CNNs, RNNs, Transformers, and more. A step-by-step guide with tools, examples, and best practices.