Blog
Consejos de enseñanza, comparaciones de herramientas y guías de diagramas científicos para educadores STEM. Crea mejores materiales para el aula con generación de diagramas con IA.
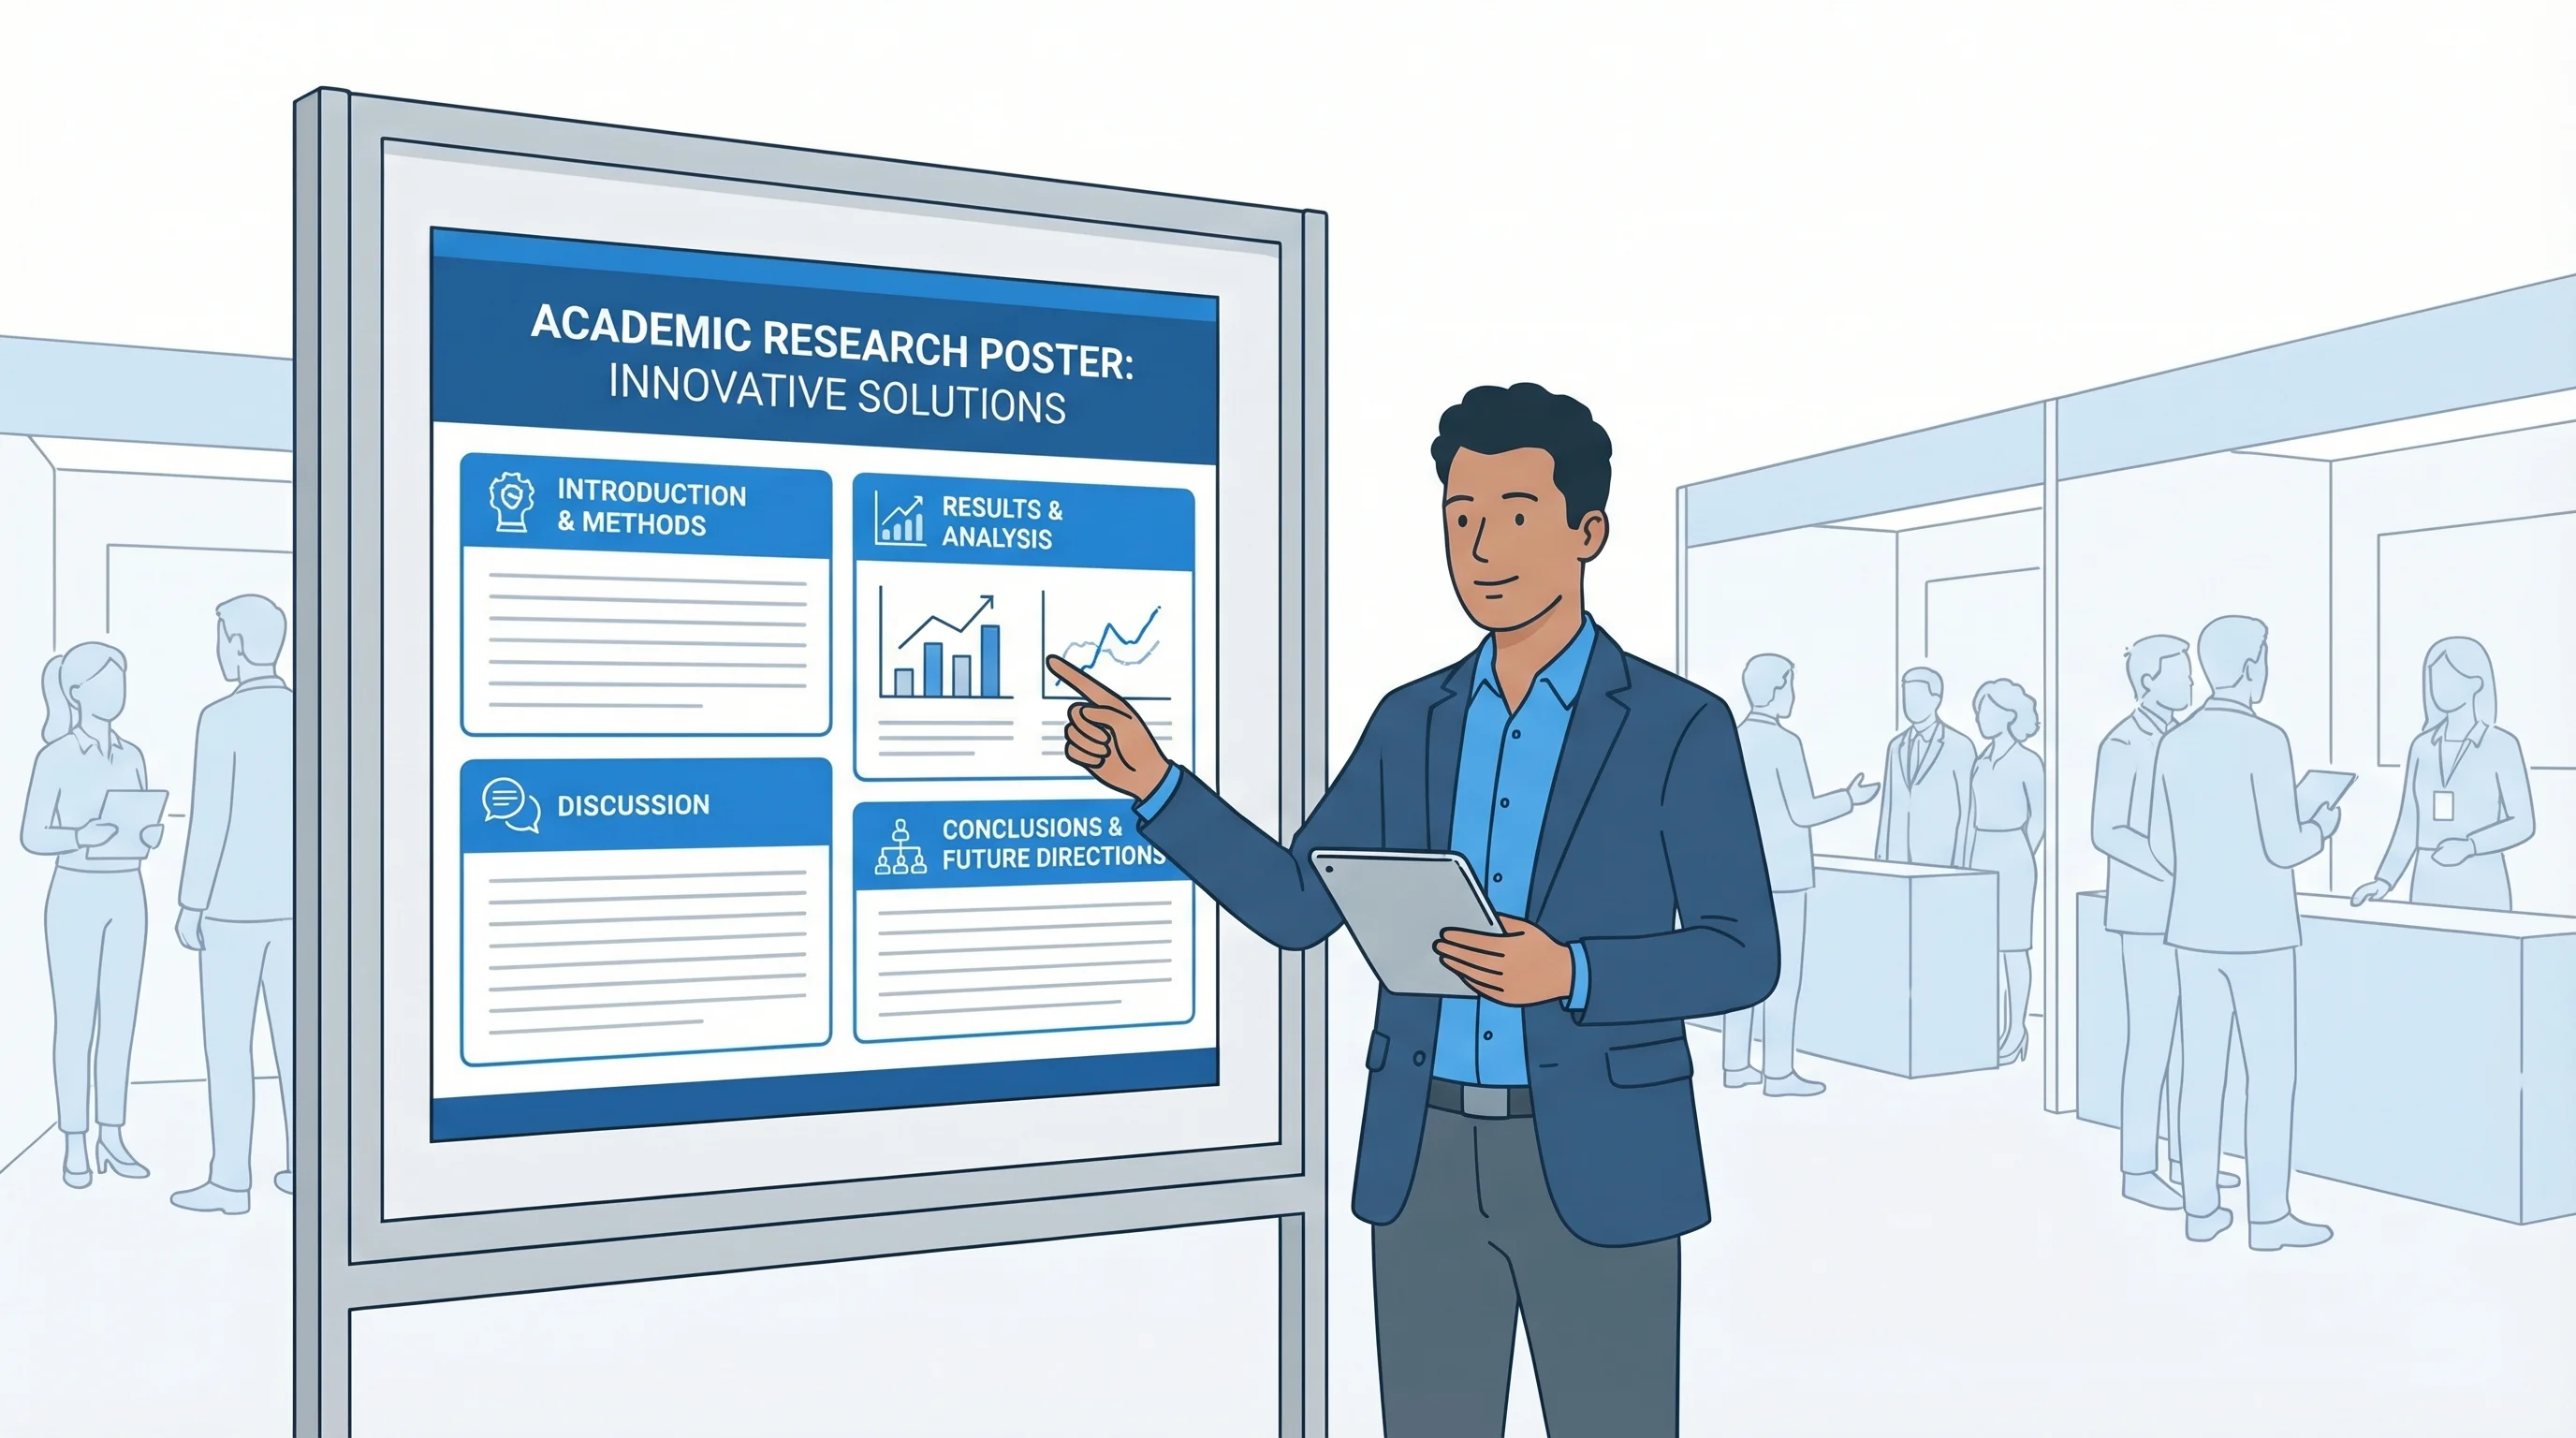
PhD Poster Design Guide: How to Create a Winning Conference Poster (2026)
Complete guide to designing PhD conference posters that stand out. Learn layout, typography, and color schemes, and use free AI tools to build research posters.
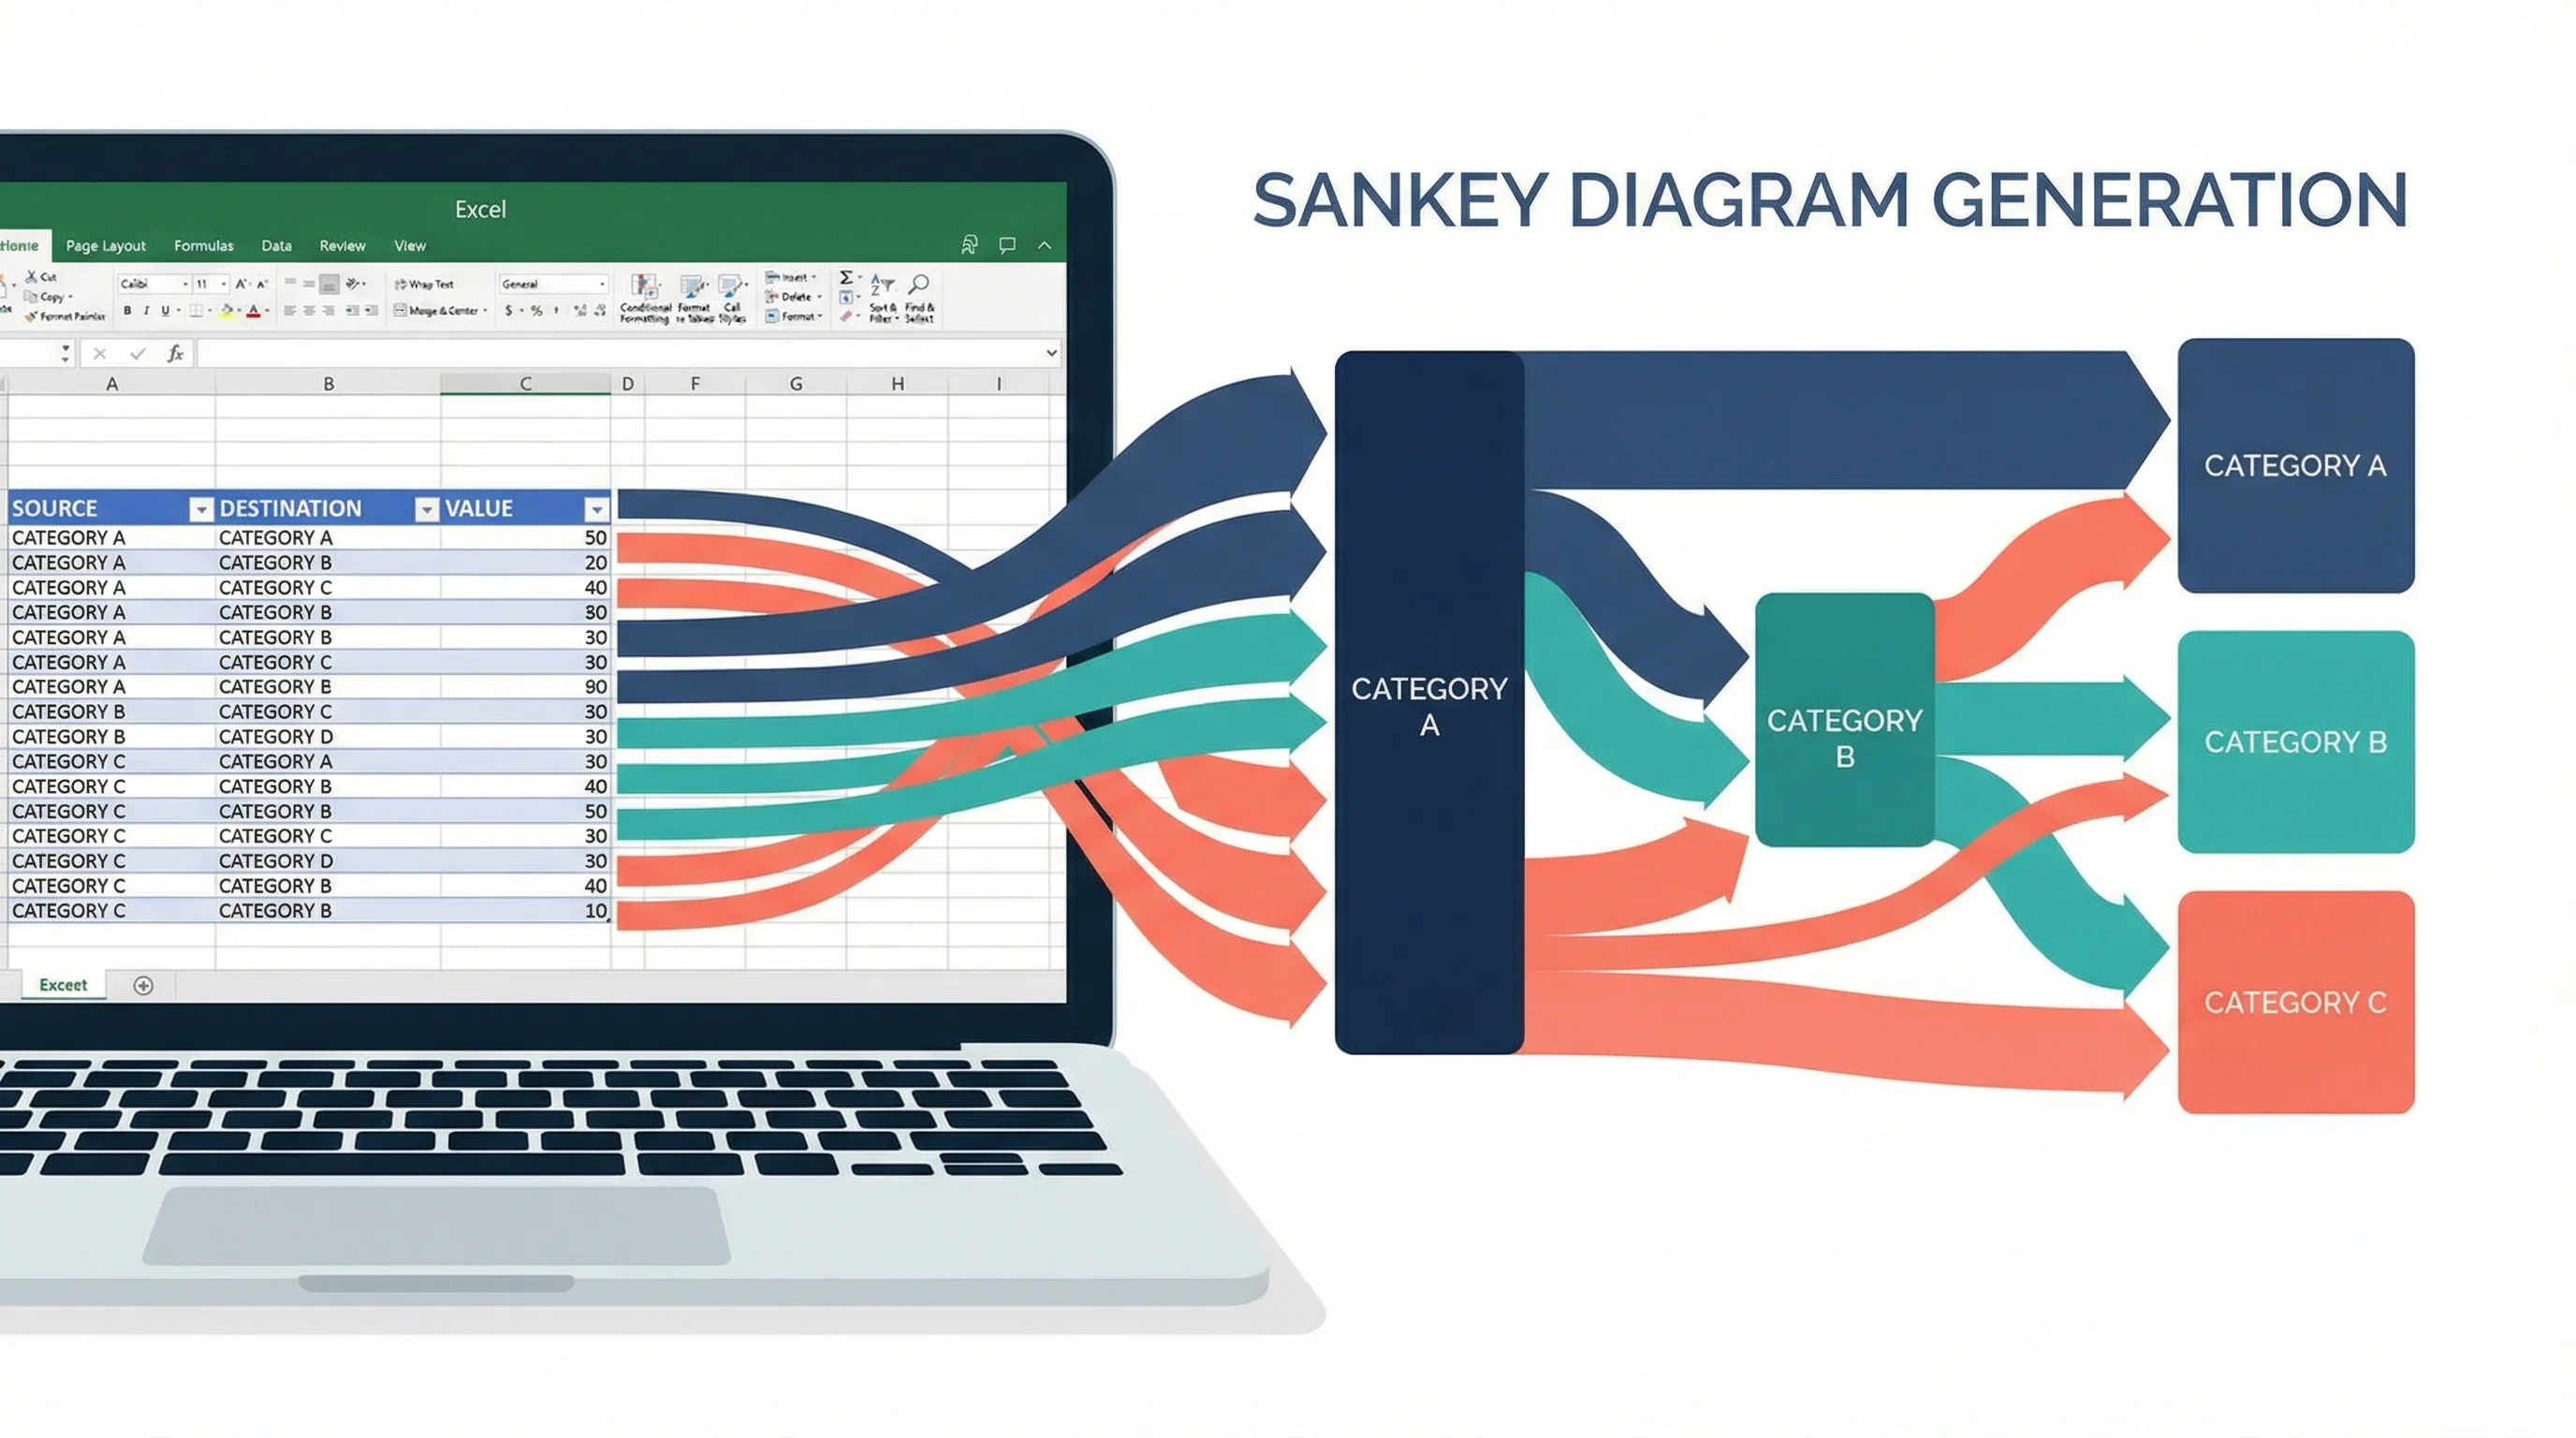
How to Create a Sankey Diagram in Excel: Step-by-Step Guide (2026)
Learn how to make Sankey diagrams in Excel using add-ins, manual workarounds, and dedicated tools. A step-by-step guide with templates and alternatives.
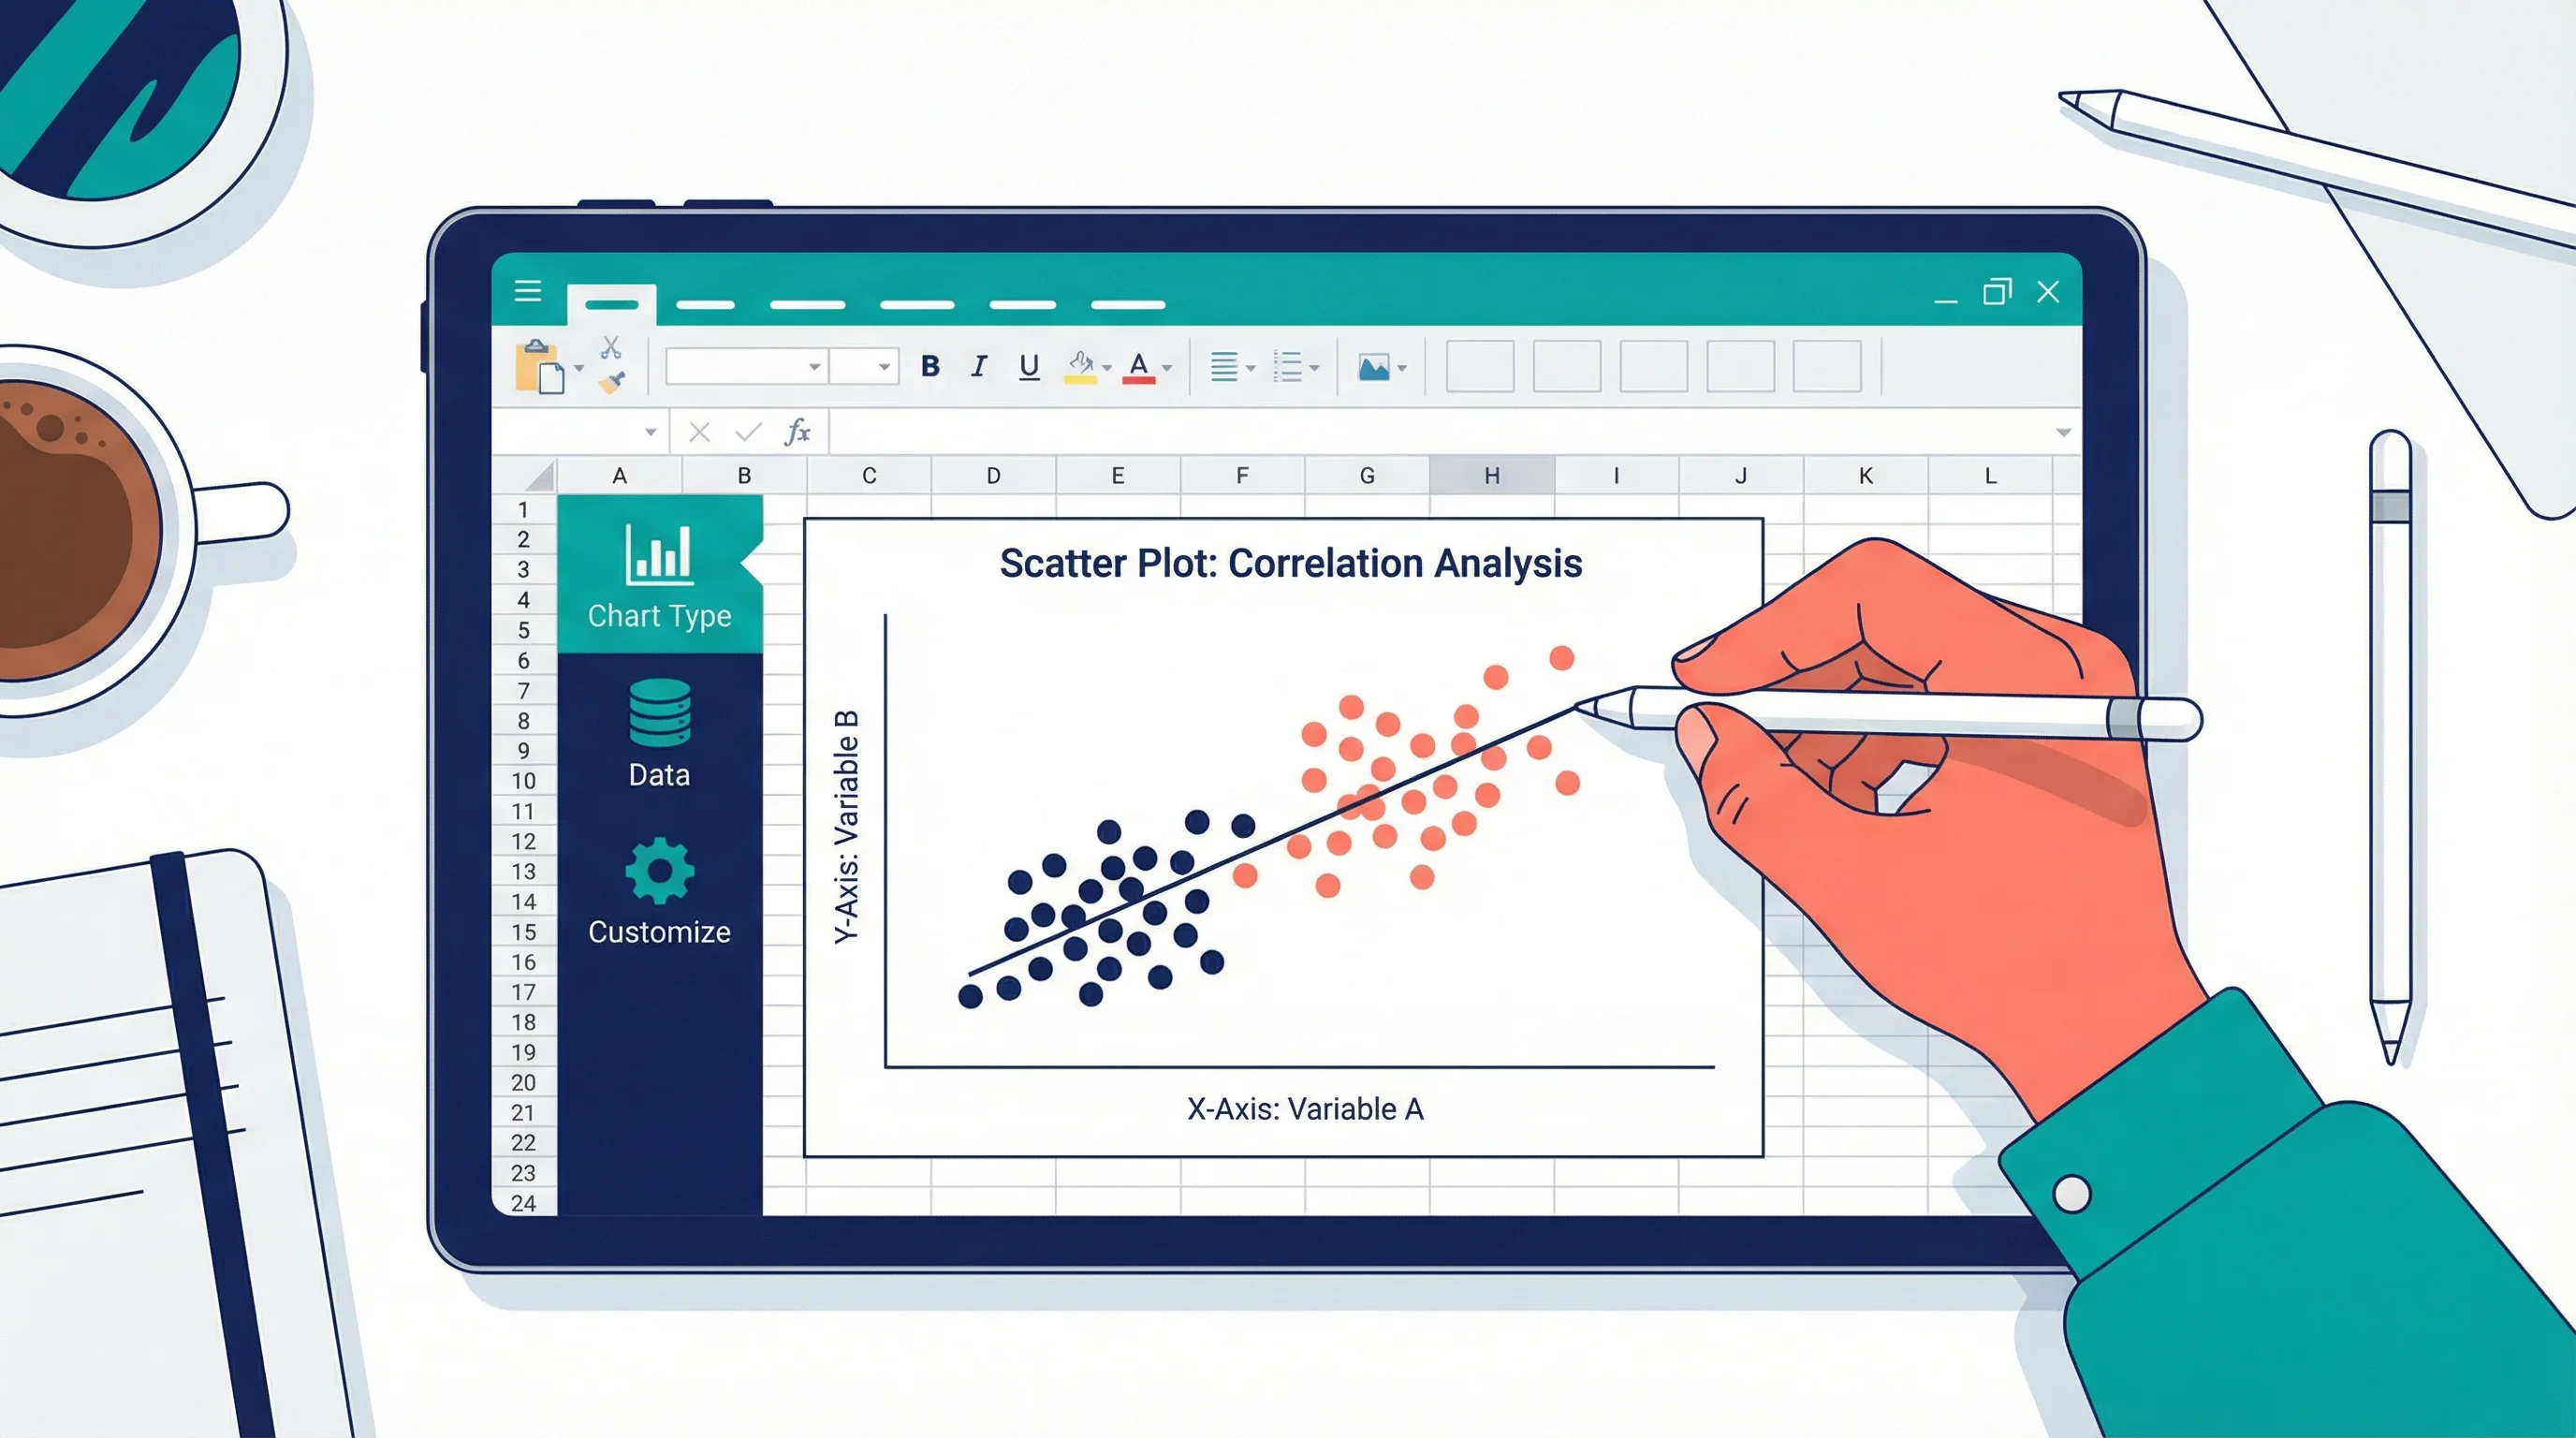
How to Create Scatter Plots in Excel: Step-by-Step Guide (2026)
Learn how to make scatter plots in Excel with trend lines, labels, and formatting. Complete guide with screenshots and tips for research data visualization.
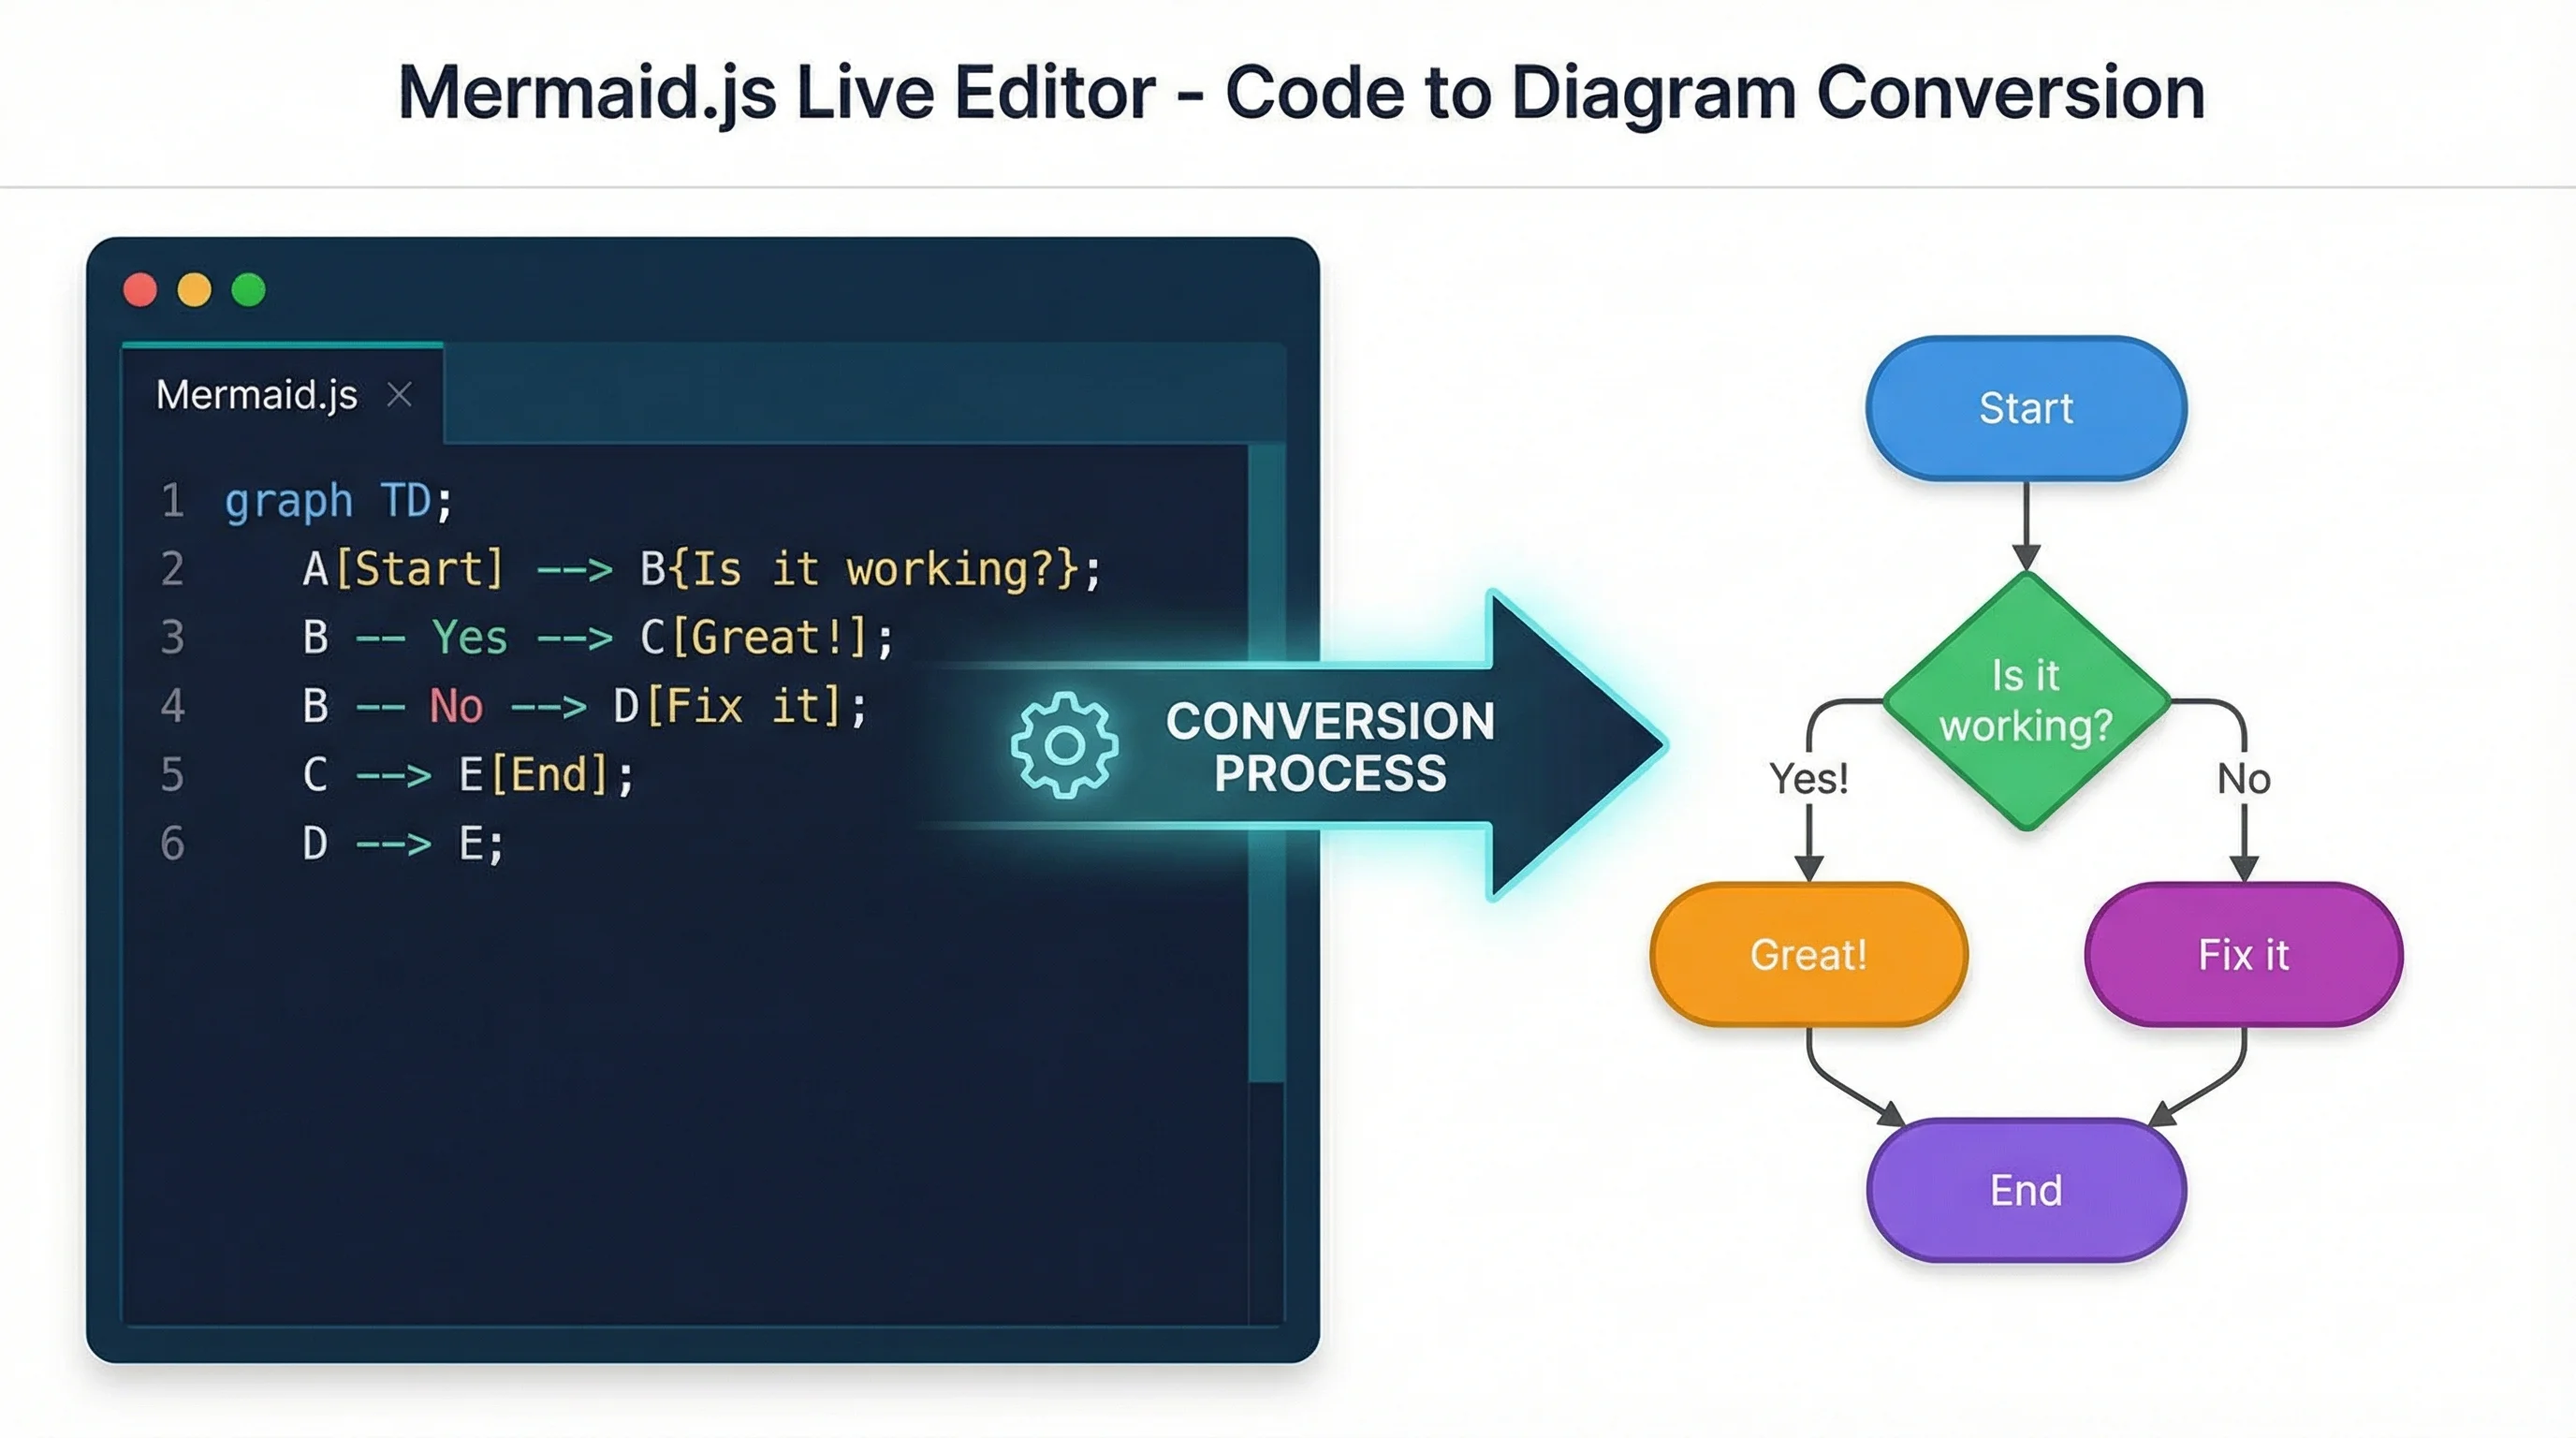
Mermaid to PNG: Export Mermaid Diagrams as PNG, SVG & PDF
Convert Mermaid diagrams to PNG, SVG or PDF with Mermaid Live Editor, mmdc CLI, VS Code and free online tools. Includes quick export steps and best formats.
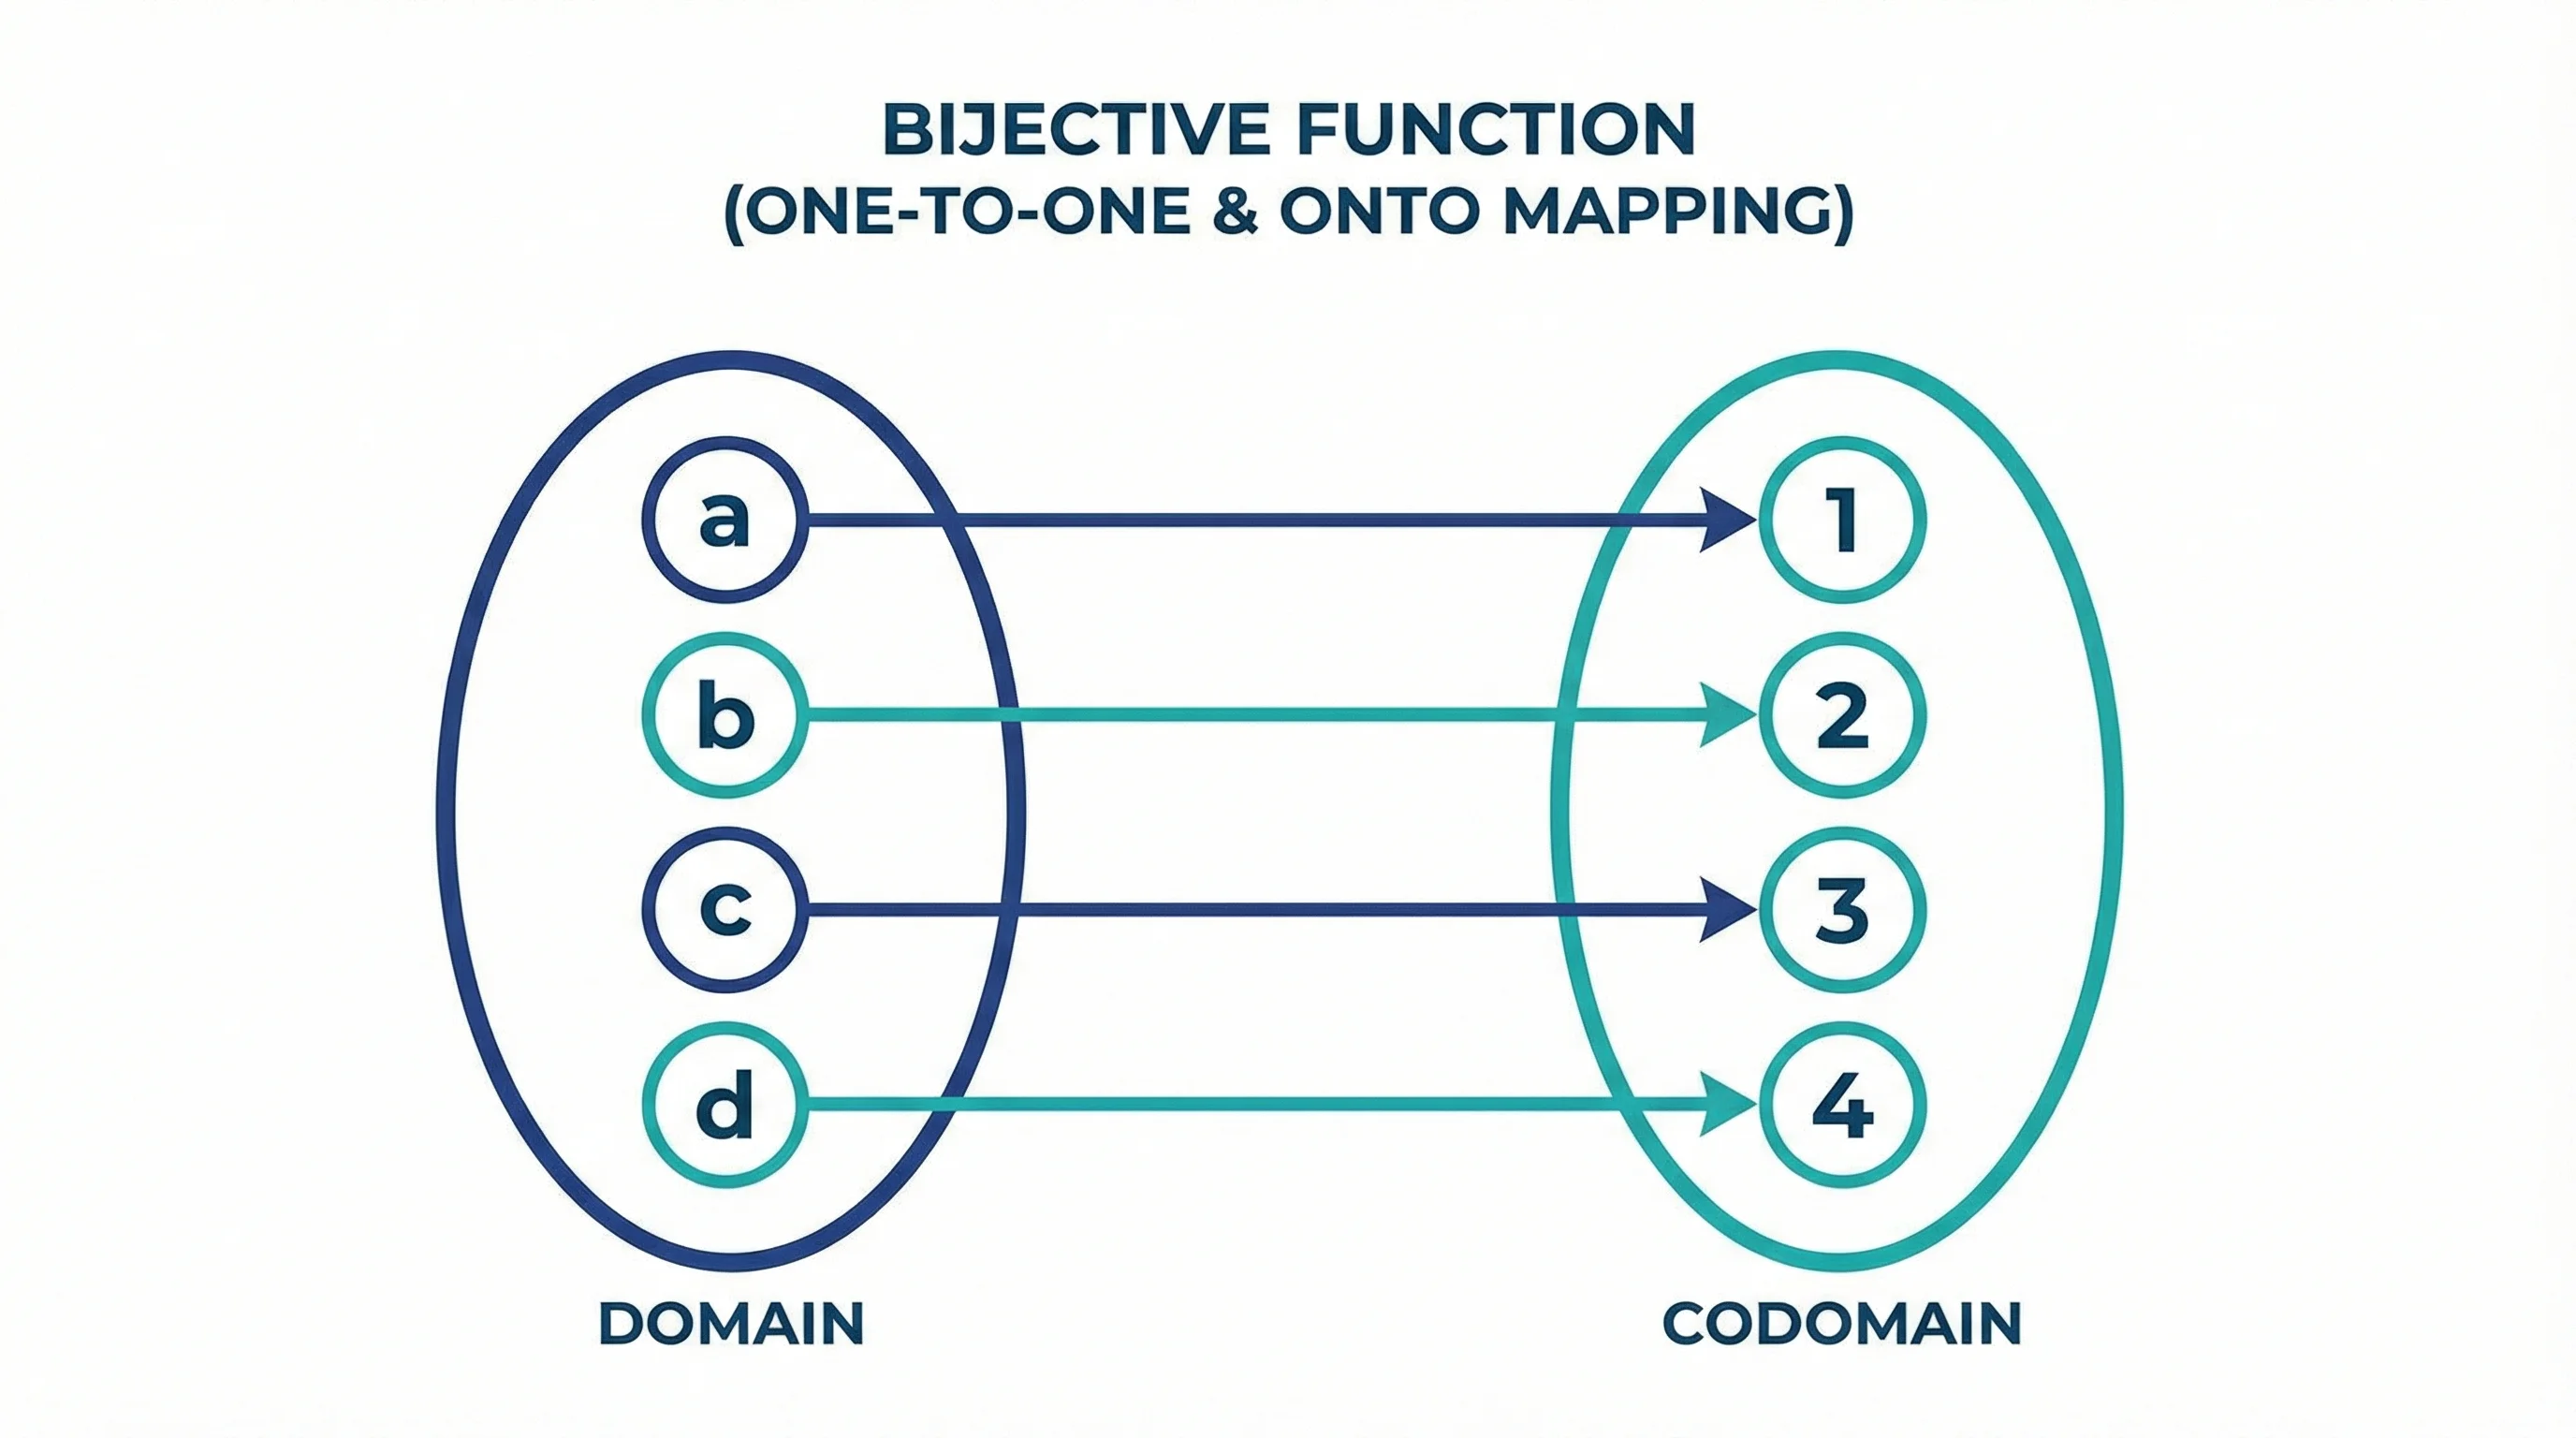
Mapping Diagrams Explained: Complete Guide with Examples (2026)
Learn what mapping diagrams are, how to create them, and when to use them in math and research. A complete guide with function mapping examples and free tools.
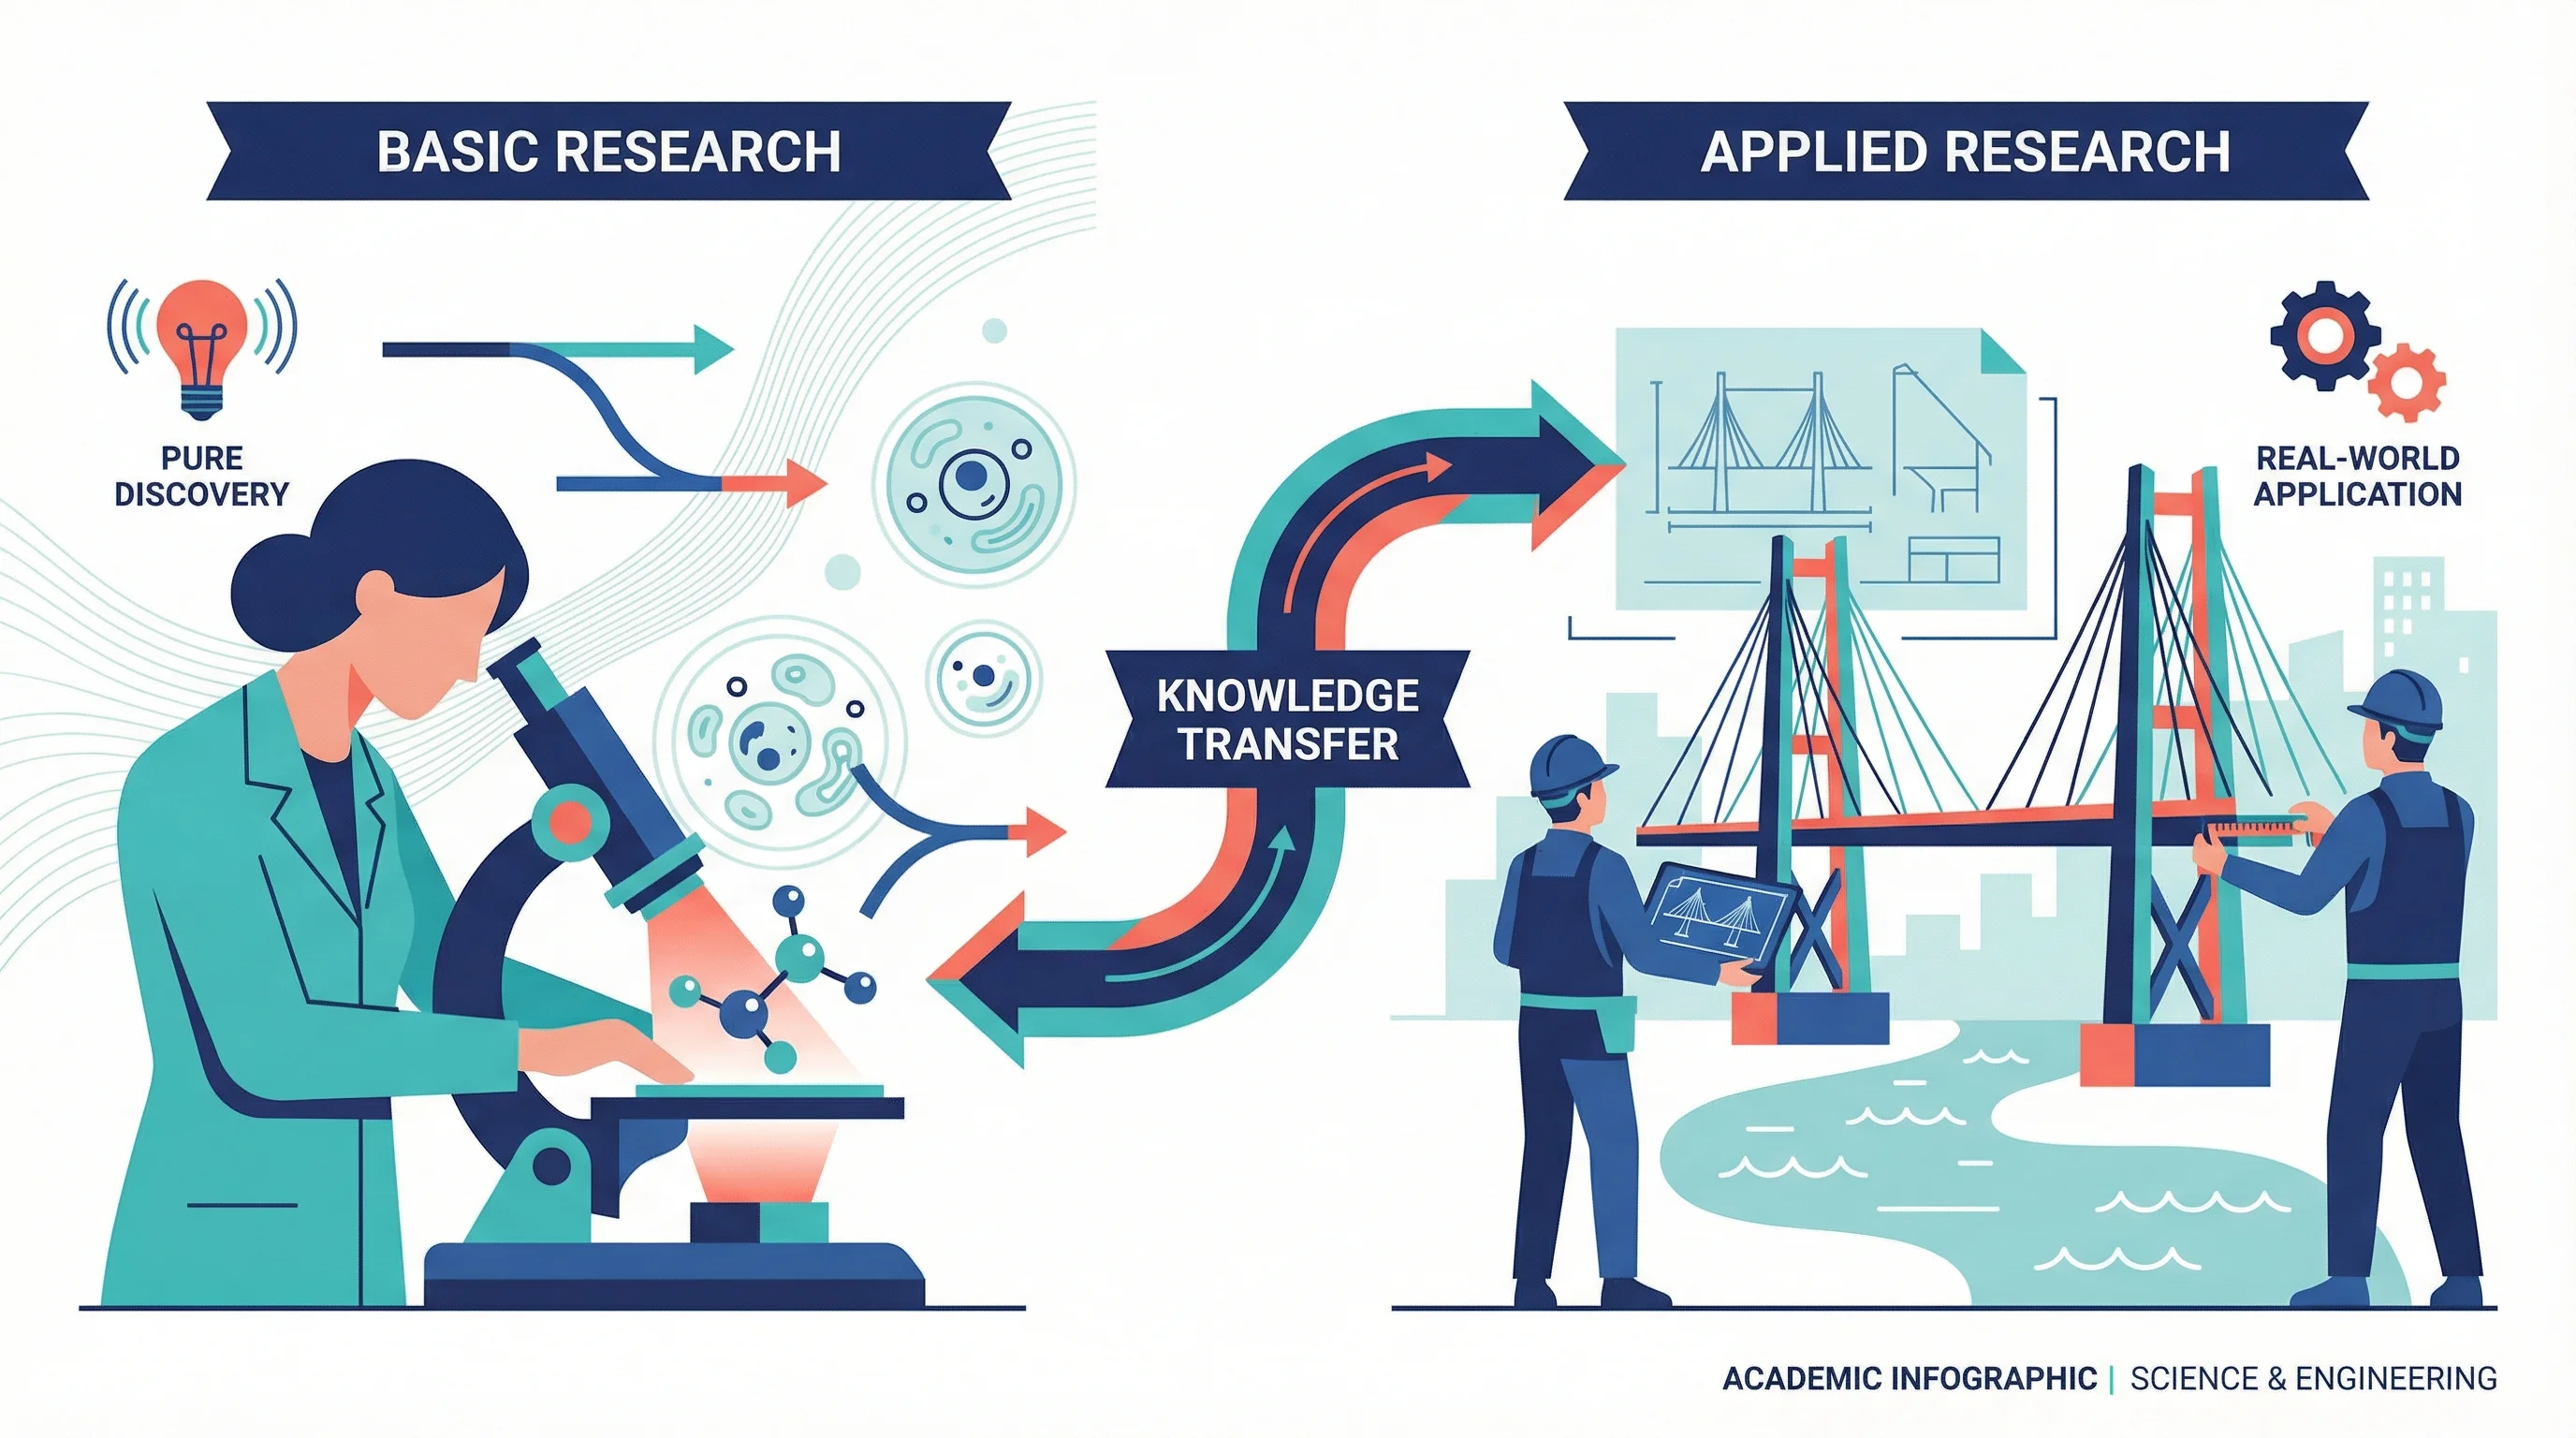
Applied vs Basic Research: Key Differences, Examples & When to Use Each
What is the difference between applied and basic research? Compare goals, methods, examples, funding, and timelines side by side.