
Titration Curve Explained: pH, Equivalence Point & pKa
A titration curve plots pH vs volume of titrant. Learn to read strong and weak acid curves, find the equivalence point, half-equivalence (pKa), and indicator.
A titration curve is a graph of pH against the volume of titrant added during an acid–base titration. Its tell-tale S-shape (sigmoidal) shows how the pH barely changes for most of the titration, then jumps almost vertically near the equivalence point, where the acid and base have exactly neutralized each other.
This guide explains what a titration curve shows, how strong-acid and weak-acid curves differ, how to find the equivalence point and the half-equivalence point (where pH = pKa), and how to pick the right indicator.
Quick Answer: What Is a Titration Curve?
A titration curve plots the pH of a solution (y-axis) against the volume of titrant added (x-axis) as you slowly add an acid or base from a burette. The curve is flat at the start, rises (or falls) gently through a buffer region, then jumps steeply at the equivalence point before flattening out again.
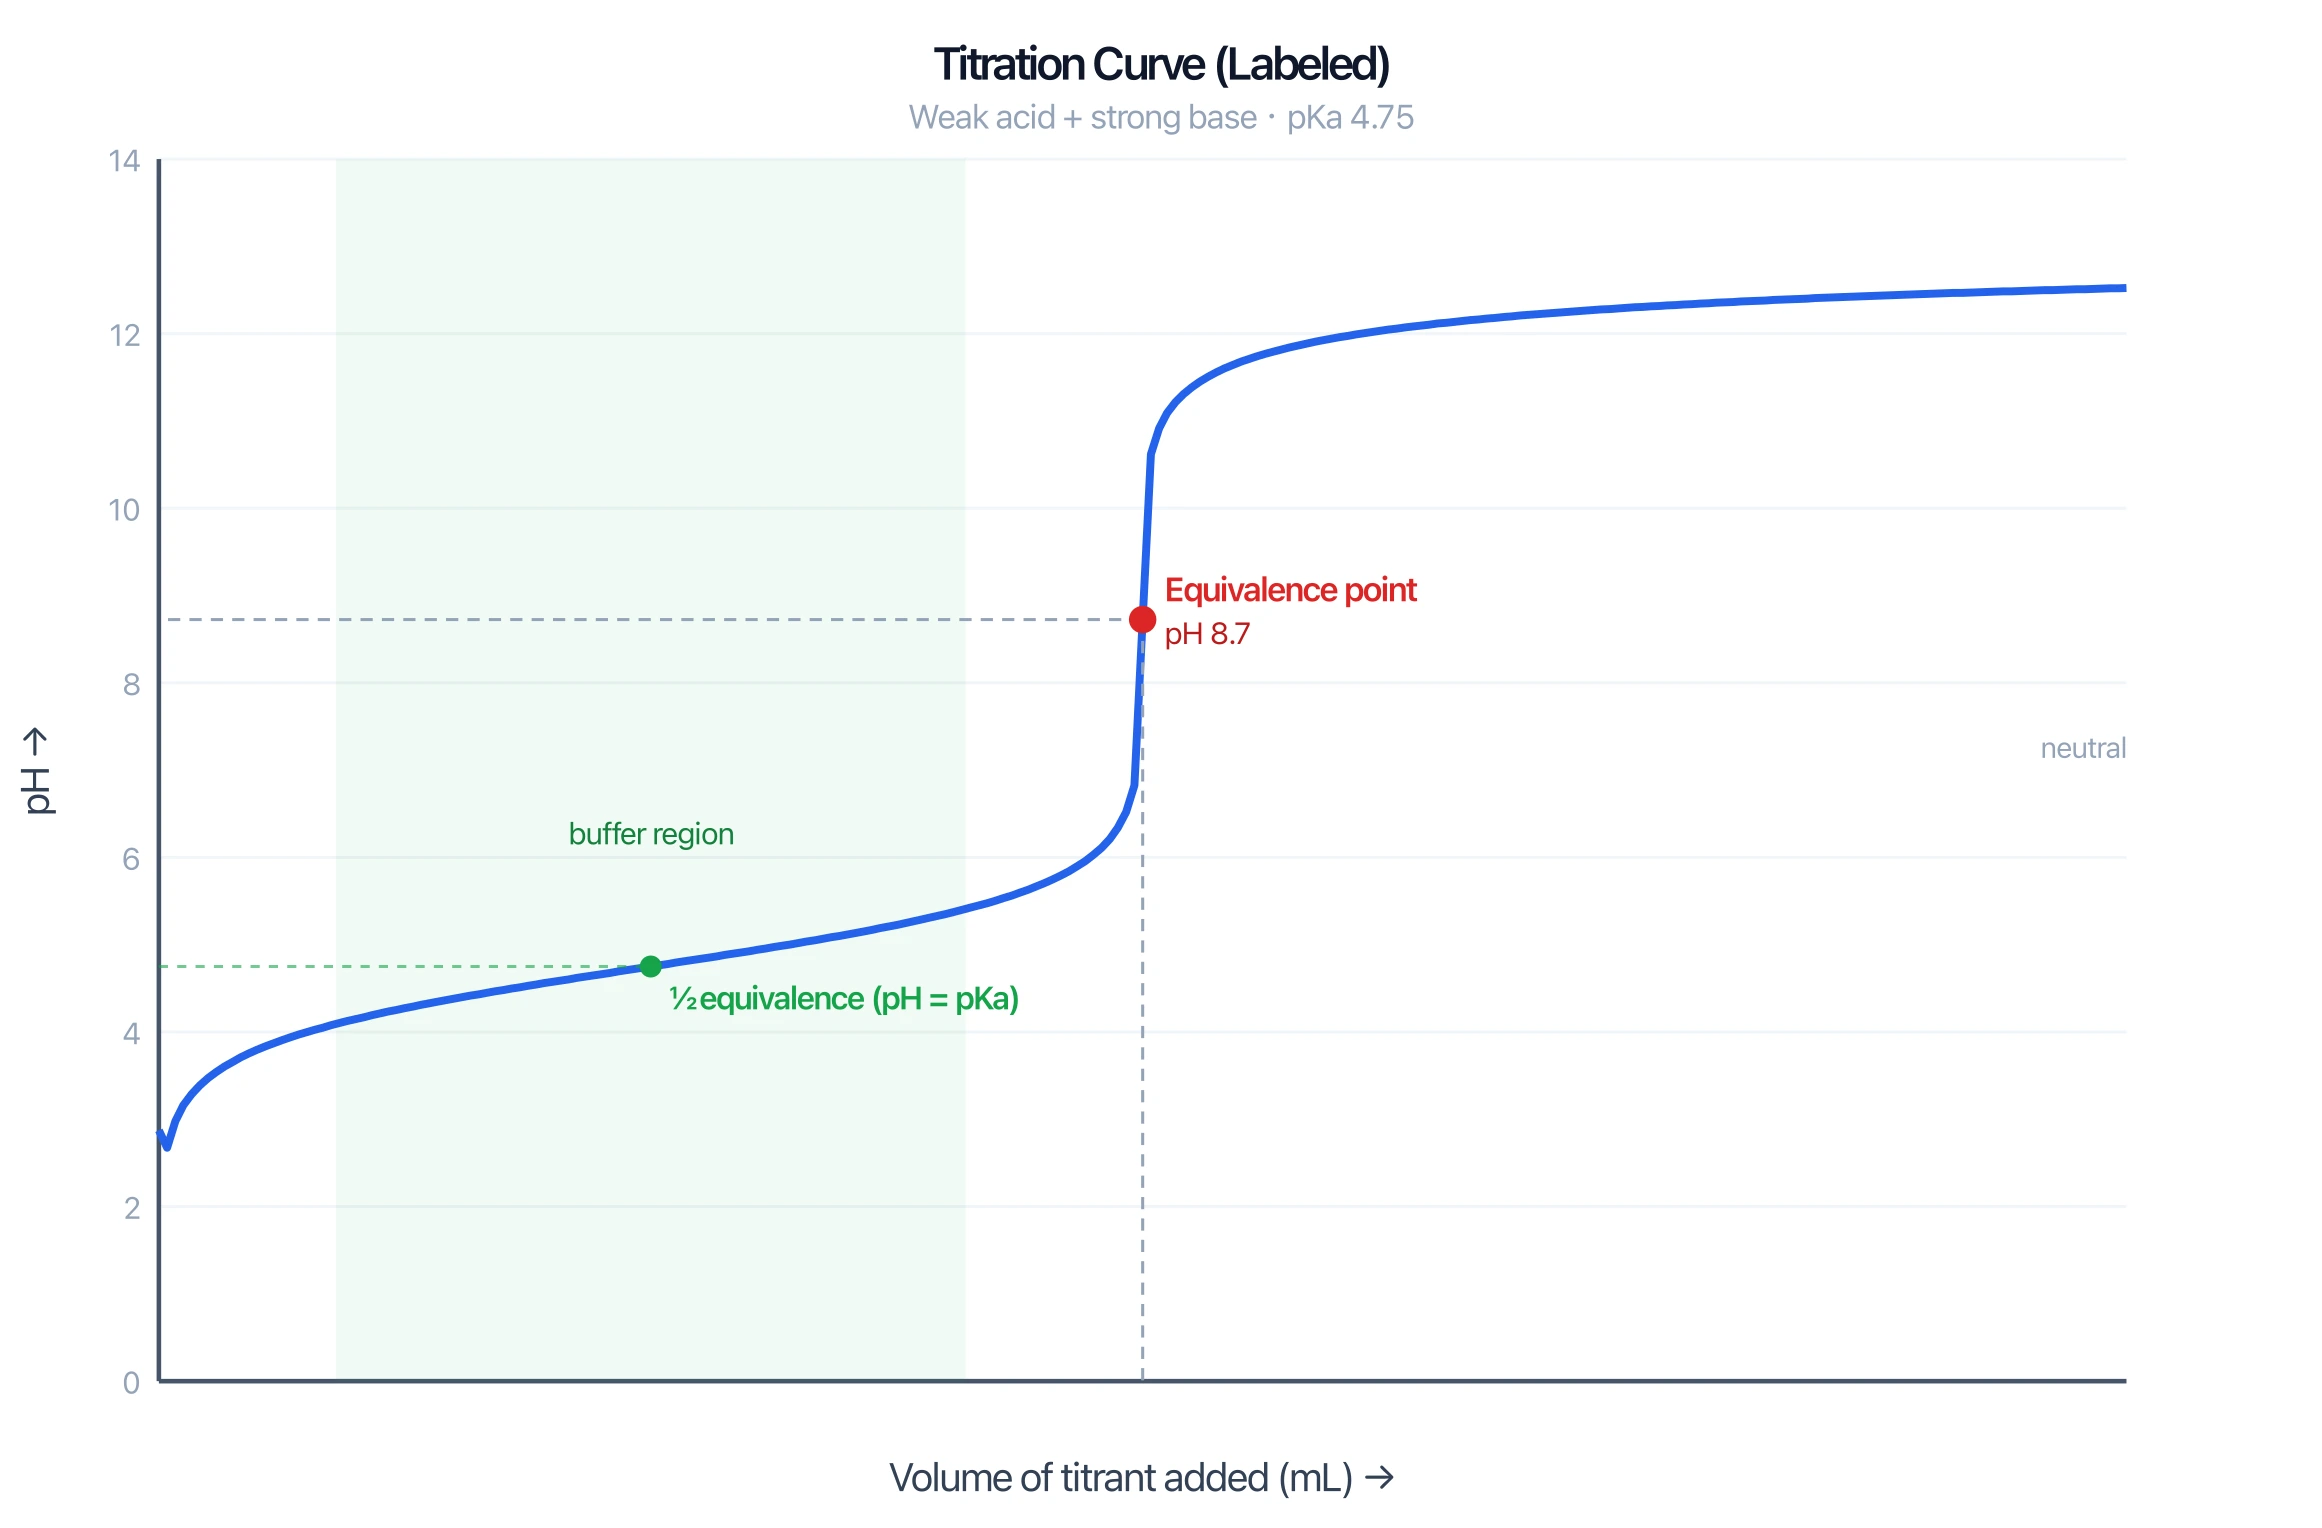
The key features you read off a titration curve are:
- The equivalence point — the steep vertical part, where moles of acid equal moles of base.
- The buffer region — the gently sloping part before the jump (for weak acids/bases).
- The half-equivalence point — halfway to equivalence, where pH = pKa for a weak acid.
Titration Curve Generator
Pick an acid–base pair and instantly get a labeled titration curve with the buffer region, half-equivalence point, and equivalence point marked.
Make a titration curve ->What a Titration Curve Shows
During a titration you add a solution of known concentration (the titrant) to a solution of unknown concentration (the analyte), measuring pH as you go. Plotting pH versus titrant volume gives the titration curve.
The shape encodes the chemistry. Where the curve is flat, adding titrant changes the pH very little — the solution is resisting change. Where it shoots up almost vertically, a single drop of titrant swings the pH by several units, because the solution has run out of anything to neutralize. The midpoint of that vertical jump is the equivalence point.
Strong Acid–Strong Base Curve
When a strong acid (such as HCl) is titrated with a strong base (such as NaOH), the curve starts at a low pH (around 1), rises slowly, then jumps very steeply through a wide pH range, and finally levels off at a high pH.
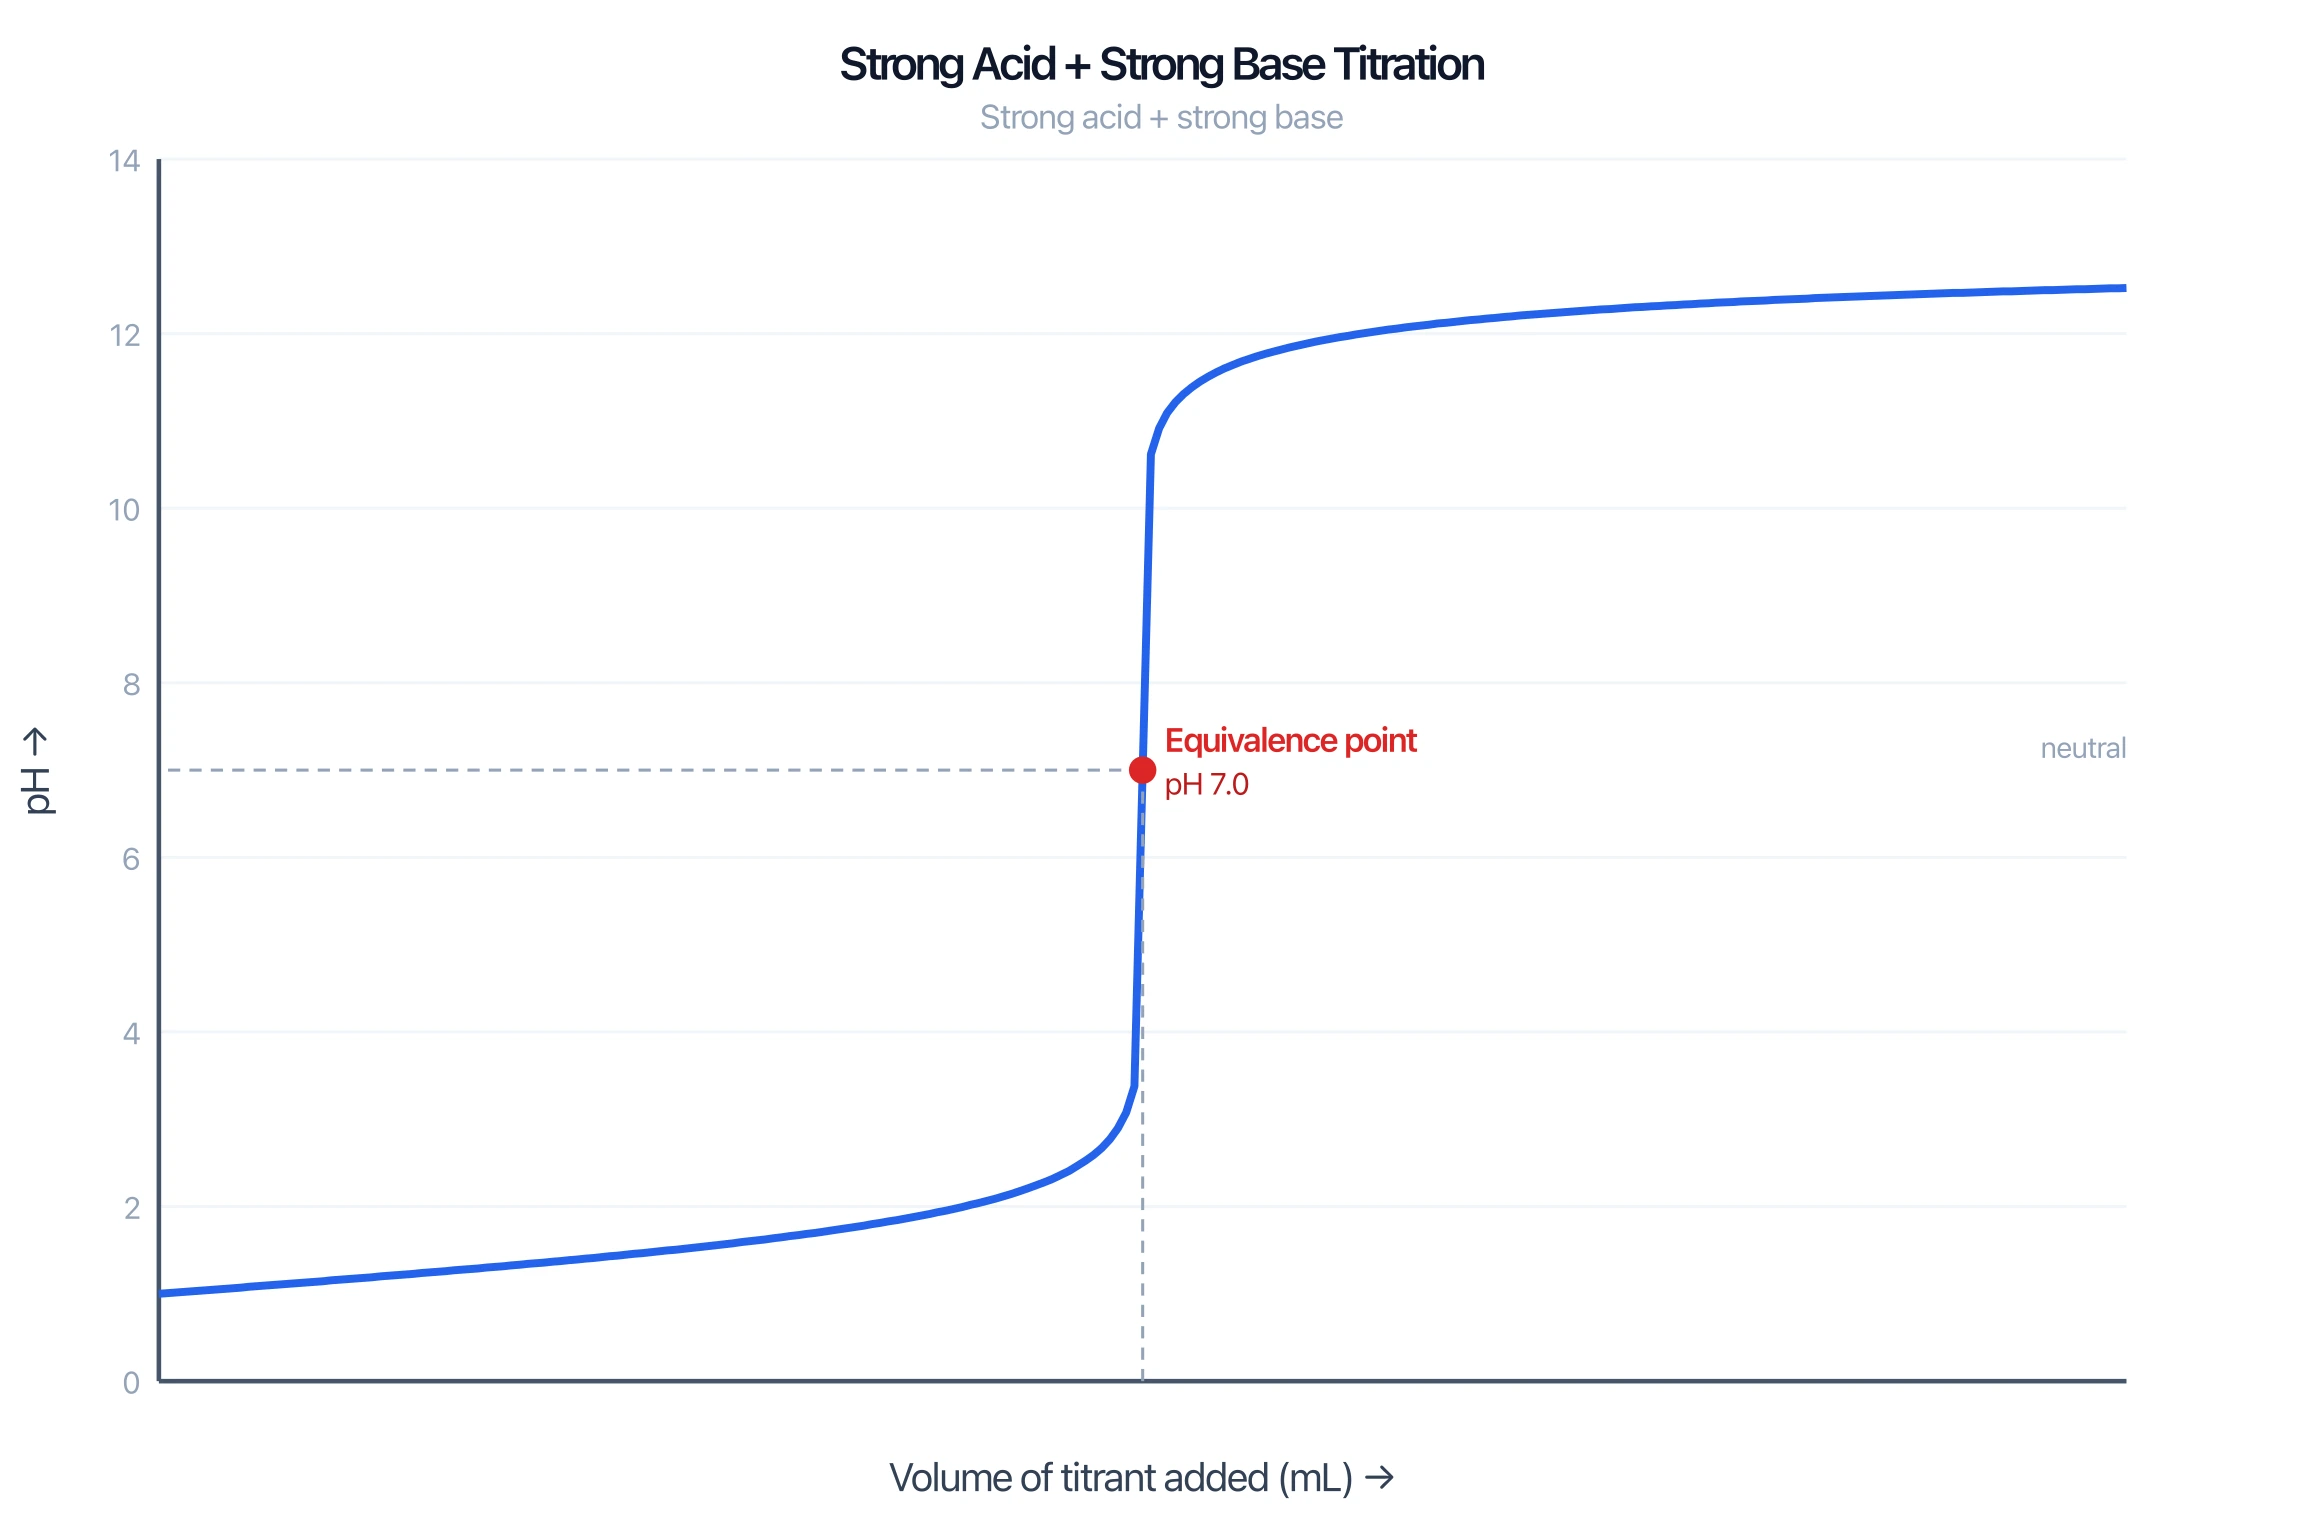
The defining feature is the equivalence point at pH 7. Because both the acid and base are strong, the salt formed (NaCl) is neutral, so the solution is exactly neutral when neutralization is complete. The vertical jump is long — often spanning pH 3 to pH 11 — which makes the equivalence point easy to pinpoint and gives you wide latitude in choosing an indicator.
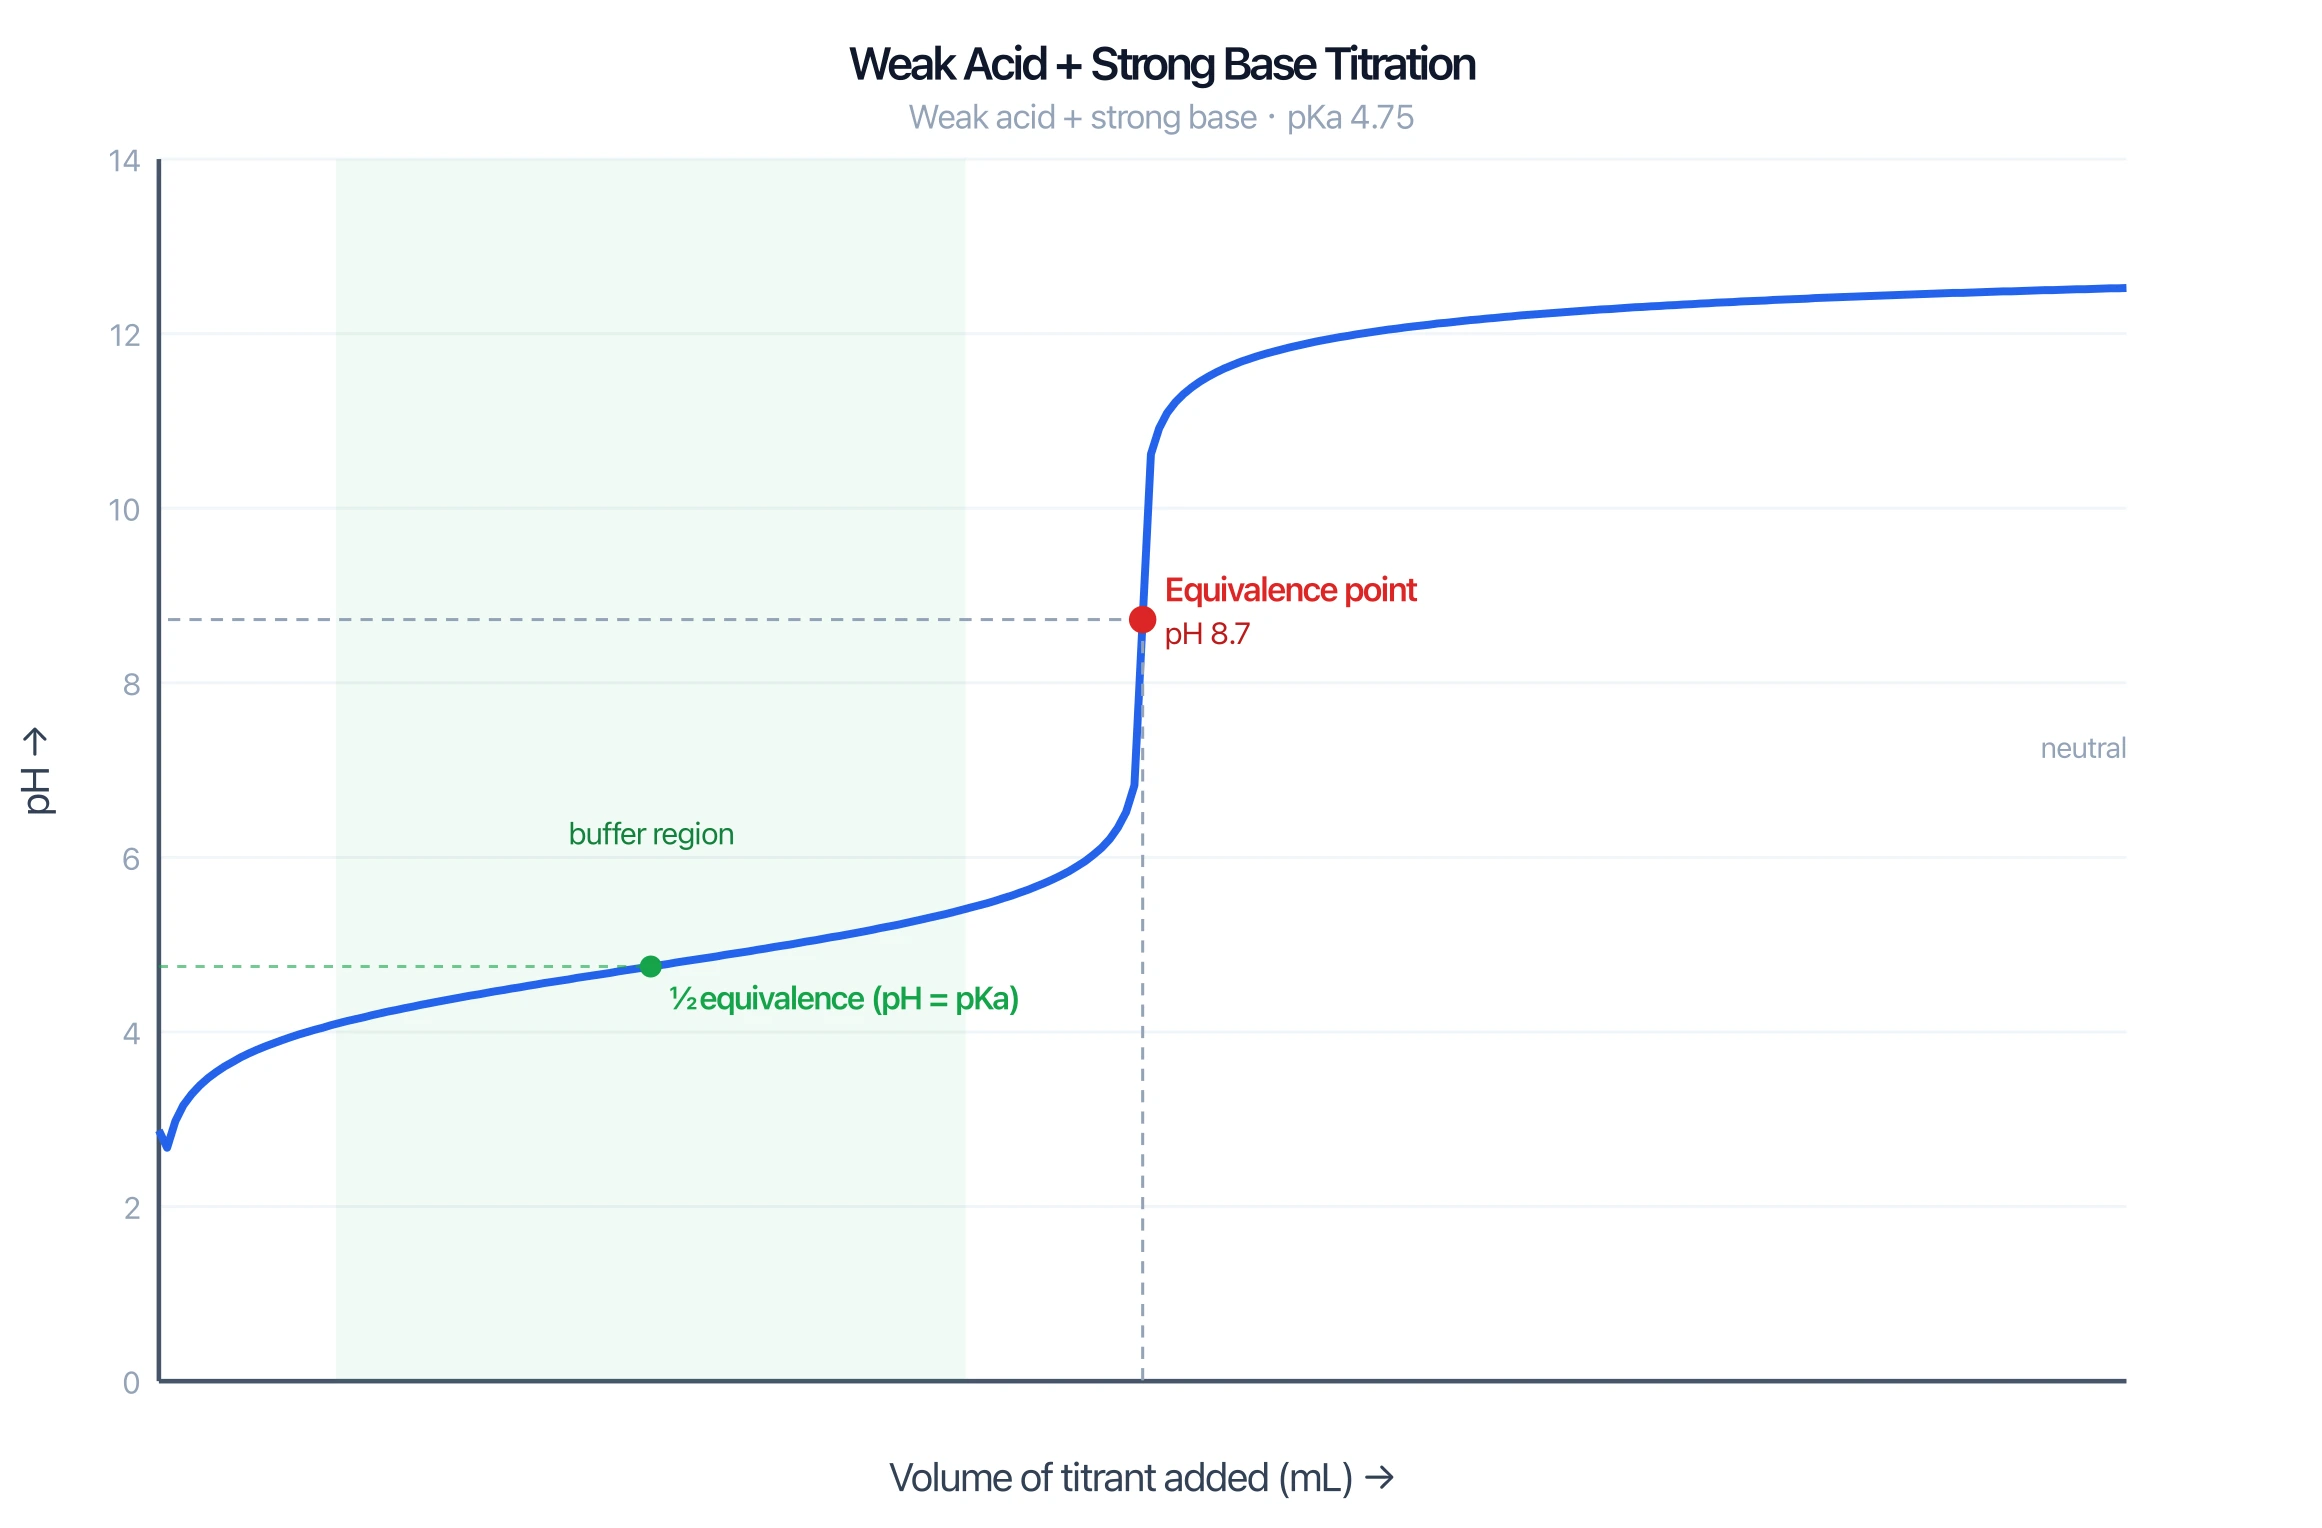
Weak Acid–Strong Base Curve
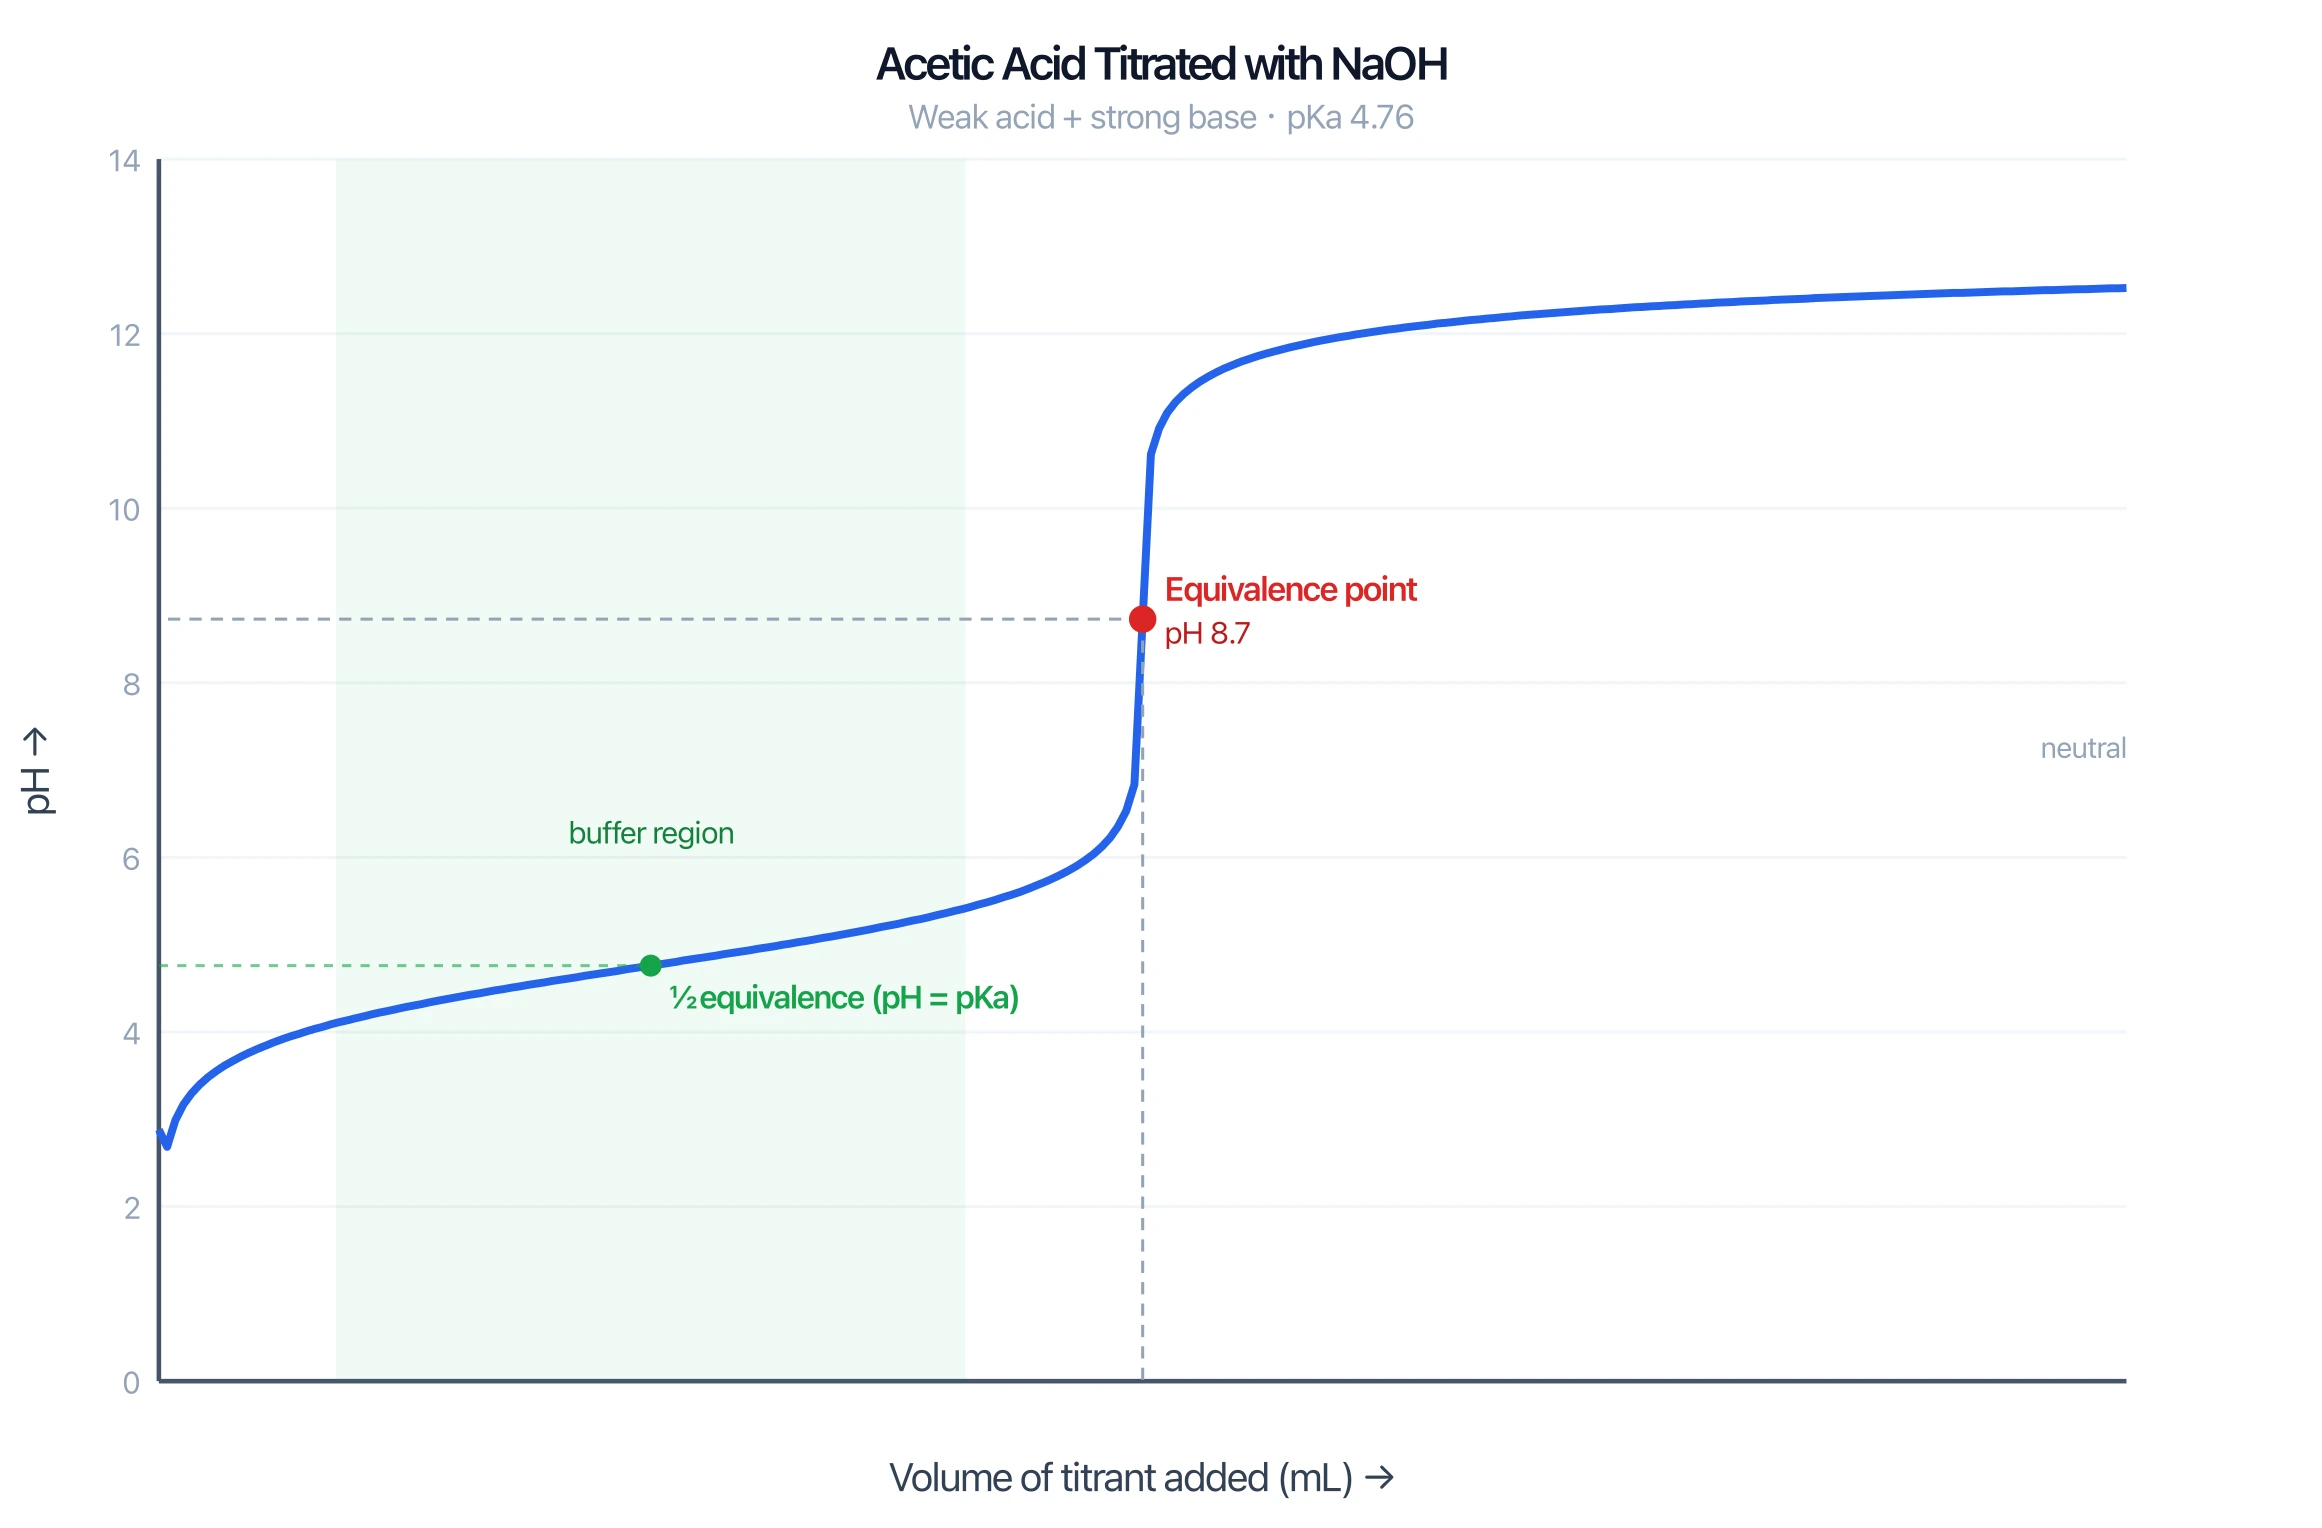
A weak acid (such as acetic acid) titrated with a strong base looks different in three important ways: it starts at a higher pH, it has a clear buffer region, and its equivalence point sits above pH 7.
Early in the titration, the weak acid and the conjugate base it produces coexist, forming a buffer that resists pH change — this is the gently sloping plateau. The equivalence point is basic (pH > 7) because the conjugate base left in solution is itself weakly basic. The vertical jump is also shorter than for a strong acid, so the indicator has to be chosen more carefully.
The Half-Equivalence Point and pKa
Halfway to the equivalence point, exactly half the weak acid has been converted to its conjugate base, so their concentrations are equal: [HA] = [A⁻]. The Henderson–Hasselbalch equation then collapses to pH = pKa.
This is enormously useful: you can read the pKa of an unknown weak acid straight off the curve by finding the pH at the half-equivalence point. The half-equivalence point sits in the middle of the buffer region, where the curve is flattest.
The Equivalence Point vs the Endpoint
These two terms are easy to confuse:
- The equivalence point is the theoretical point where moles of titrant exactly equal moles of analyte. It is defined by the chemistry and shown by the steep part of the curve.
- The endpoint is the point where your indicator changes color and you stop adding titrant. It is what you actually observe in the lab.
A good titration is designed so the endpoint falls as close to the equivalence point as possible. The small gap between them is the titration error.
Choosing an Indicator
An indicator is a weak acid or base that changes color over a narrow pH range. The rule is simple: the indicator's color-change range must lie within the steep vertical part of the titration curve.
- Strong acid + strong base: the jump spans roughly pH 3–11, so almost any indicator works — phenolphthalein (8.2–10) or methyl orange (3.1–4.4) are both fine.
- Weak acid + strong base: the equivalence point is basic, so use phenolphthalein, which changes color around pH 8–10.
- Weak base + strong acid: the equivalence point is acidic, so use methyl orange or methyl red, which change in the acidic range.
How to Read or Draw a Titration Curve
- Set up the axes: pH on the y-axis, volume of titrant added (mL) on the x-axis.
- Mark the starting pH — low for an acid being titrated, high for a base.
- Identify the buffer region — the gentle slope before the jump (only present for weak acid/base).
- Find the half-equivalence point — halfway to equivalence; for a weak acid, the pH here equals the pKa.
- Locate the equivalence point — the midpoint of the steep vertical section; note whether its pH is 7, above 7, or below 7.
- Read the final plateau — the pH levels off as excess titrant dominates.
Common Mistakes
- Confusing equivalence point with endpoint. Equivalence is the chemistry; the endpoint is the color change you see.
- Assuming every equivalence point is at pH 7. Only strong–strong titrations are neutral at equivalence; weak acid titrations are basic and weak base titrations are acidic.
- Reading pKa at the equivalence point. The pKa is read at the half-equivalence point, not the equivalence point.
- Choosing the wrong indicator. An indicator that changes outside the vertical jump gives a large titration error.
- Forgetting the buffer region. Strong-acid curves have essentially no buffer region; weak-acid curves have a clear one.
FAQ
What does a titration curve show?
A titration curve shows how the pH of a solution changes as titrant is added. The flat regions show pH resisting change, while the steep vertical part marks the equivalence point where neutralization is complete.
How do you find the equivalence point on a titration curve?
The equivalence point is the midpoint of the steepest, near-vertical section of the curve — the point of maximum slope. At this point the moles of acid equal the moles of base.
Why is the equivalence point not always at pH 7?
It is only pH 7 for a strong acid–strong base titration. A weak acid titrated with a strong base has a basic equivalence point (pH > 7), and a weak base titrated with a strong acid has an acidic equivalence point (pH < 7), because of the salt formed.
What is the half-equivalence point and why does it matter?
The half-equivalence point is where half the analyte has been neutralized. For a weak acid, the concentrations of the acid and its conjugate base are equal there, so pH = pKa — letting you read the acid's pKa directly from the curve.
How do you choose the right indicator for a titration?
Choose an indicator whose color-change pH range falls within the steep vertical part of the curve near the equivalence point. Phenolphthalein suits basic equivalence points; methyl orange suits acidic ones.
Titration Curve Generator
Generate a labeled pH-vs-volume titration curve for any strong or weak acid–base pair in seconds.
Related Guides
- Heating Curve of Water: The 5 Stages — another classic chemistry curve, this one tracking temperature versus heat added.
Further Reading
Категории
Ещё публикации

Best AI Diagram Generators in 2026 Compared
Compare the top AI diagram generators for UML, ER, Venn, electrical, and architecture diagrams. Turn text into professional visuals in seconds.

Use Case Diagram Generator Guide: Create UML Use Cases from Text
Learn how to use a use case diagram generator, define actors and system boundaries, write better prompts, and avoid common UML notation mistakes.

Infographic Design Styles & Trends: Flat, Isometric, Hand-Drawn and Minimalist
Compare infographic design styles and trends: flat, isometric, hand-drawn, minimalist, 3D and editorial layouts, with examples and selection rules.